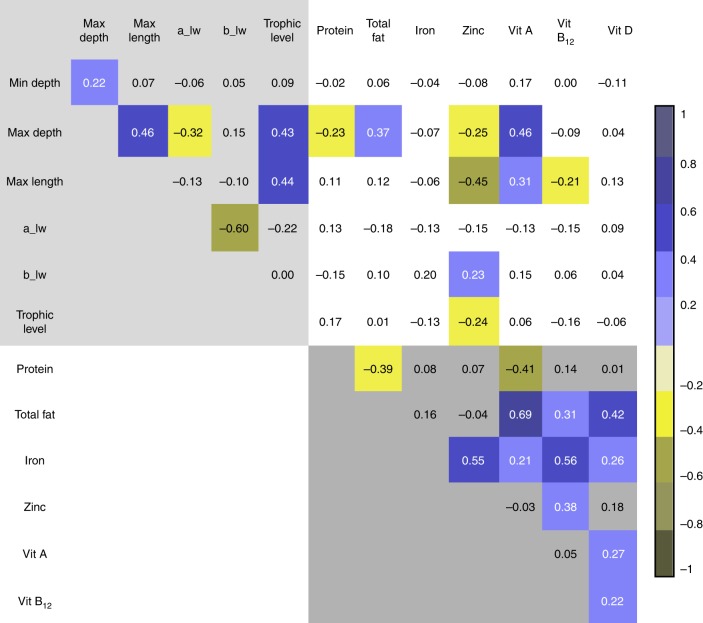
Fig. 1.
Evolutionary correlation matrix of key variables, log-transformed. Colored cells indicate correlations significant at p < 0.1 (Pearson’s r). Lightly shaded top left corner shows correlations between life history variables; darkly shaded bottom right corner shows correlations between nutrient variables. Unshaded top right corner shows correlations between life history and nutrient variables. The variables 'min depth' and 'max depth' refer to habitat preferences. 'Max length' refers to maximum reported length of the species. The variables 'a_lw' and 'b_lw' refer to the scalar and exponential parameters in the length-weight relationship equation W = aLb, wherein W is weight and L is length. 'Trophic level' refers to the weighted mean of the trophic level of the diet of the species. See Table 1 for more details

