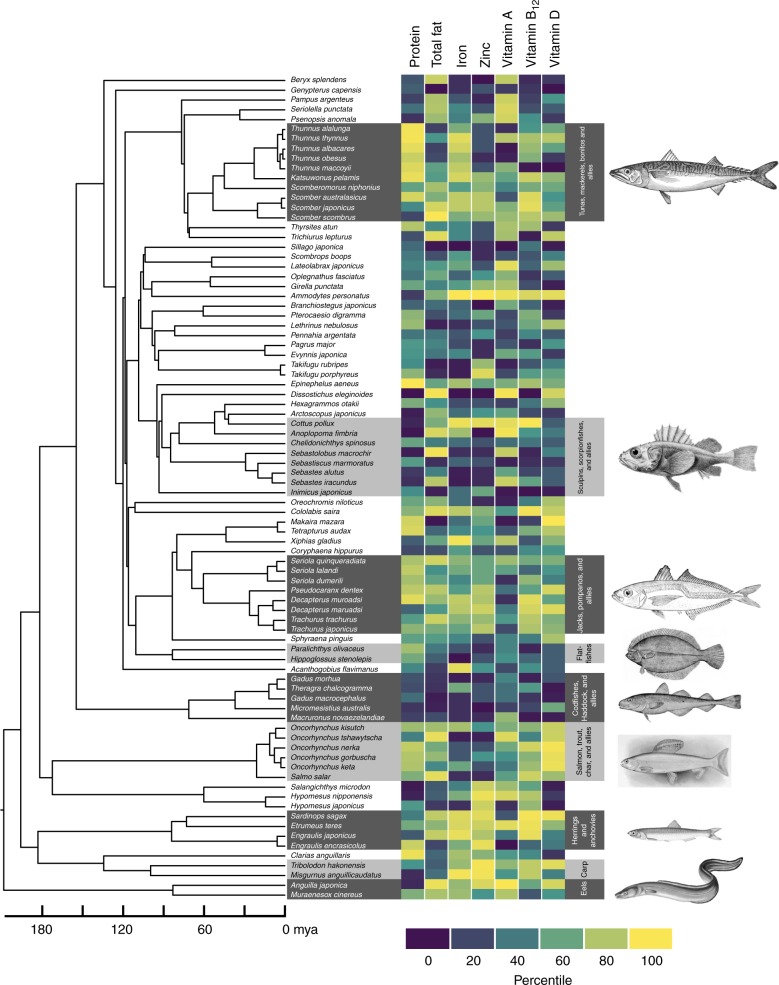
Fig. 2.
Phylogenetic relationships and nutrient content, expressed in percentiles. Eighty-four of the most commercially and nutritionally important of the 371 species in the database described above are shown. The time-scale is shown as millions of years ago (mya). The color scales indicate percentiles of nutrient content; see Supplementary Table 1 for ranges of each variable. Common names and pictorial representations of select groups of fishes are shown. All images are taken from Wikipedia, and are Public Domain images

