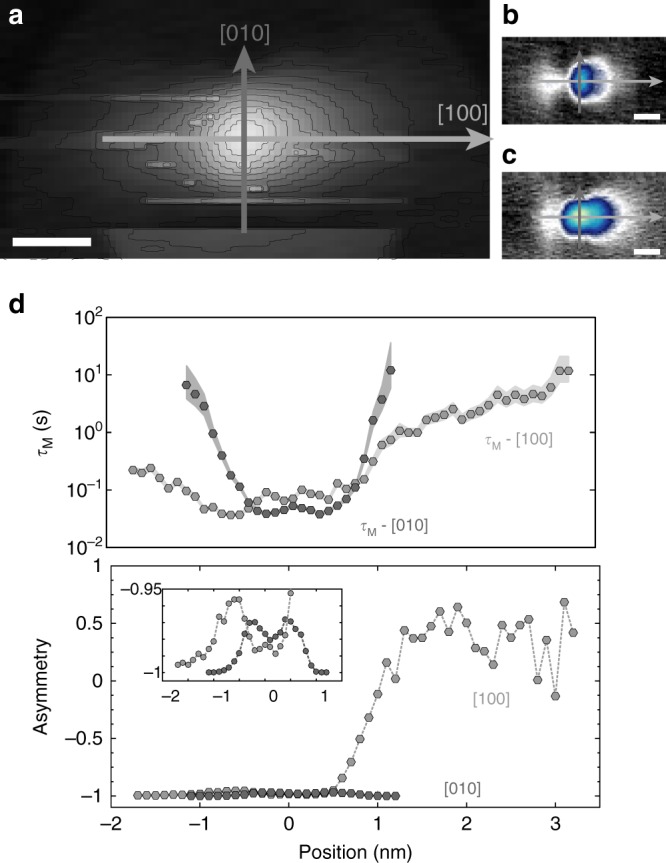
Fig. 5.

Anisotropic gating. a Constant-height current map showing Co charge density at Vs = 500 mV (setpoint conditions: Vs = 500 mV, It = 40 pA, scale bar = 1 nm). Dark gray and light gray arrows show measurement positions for d along [010] and [100], respectively. b Measurement locations shown on constant-current image of JH,low (Vs = −400 mV, It = 20 pA, scale bar = 1 nm). c Measurement locations with reference to JH,high (Vs = −400 mV, It = 20 pA, scale bar = 1 nm). d Spatially resolved constant height measurements (setpoint conditions: Vs = 500 mV, It = 40 pA). Mean lifetime (top) and state asymmetry (bottom) as a function of position along (light gray) [100] and (dark gray) [010] directions. (Inset, bottom panel) Rescaled plot of asymmetry data from positions −2 to 1 nm. The constant height image in a was taken with precisely the same tip height and bias to show the length scale of the ionized atomic wavefunction (atom is primarily in JH,low). Position 0 nm corresponds to the center of the Co atom. Data were collected with Vs = 500 mV
