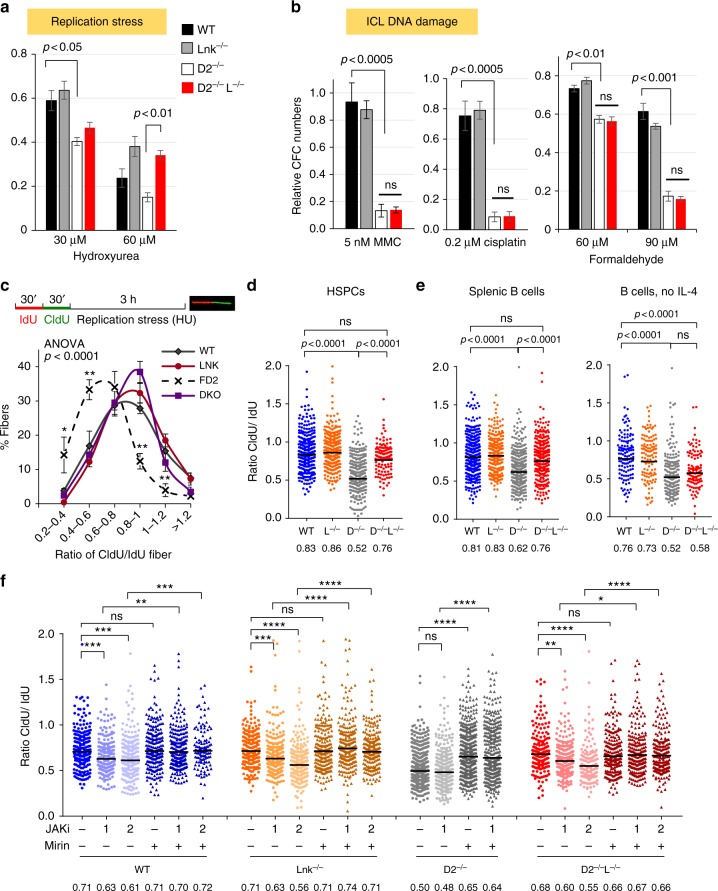
Fig. 6.
Lnk deficiency stabilizes stalled replication forks in Fancd2−/− HSPCs through cytokine-JAK2 signaling. a, b BM cells from WT, D2−/− and D2−/−L−/− mice were plated in semi-solid methylcellulose media containing HU that induces replication stress (a) or indicated ICL DNA damage-inducing drugs, MMC, cisplatin, formaldehyde (b). Colony forming progenitor numbers relative to the vehicle-treated group (mean± SE) were enumerated and graphed. Representatives of three independent experiments are shown. Statistics were calculated using two-tailed Student’s t-test. (c). The top panel shows the experimental overview of the fork protection assay in single-molecule DNA fibers upon HU-mediated replication stalling. c, d Freshly isolated HSPCs (LSKs) from WT, D2−/−, Lnk−/−, and D2−/−Lnk−/− (D2−/−L−/−) mice were subjected to fork protection assay. The frequencies of different replication tract ratios are plotted in (c). The distributions of CldU/IdU fiber ratios are shown in (d). e Splenic B cells were cultured in RP-105 and LPS with (Left) or without IL-4 (Right), then subjected to fork protection assay. (f) HSPCs from WT, D2−/−, and D2−/−L−/− BMs were cultured in cytokines then subjected to the fork protection assay. 0, 1, or 2 µM JAK inhibitor ruxolitinib (JAKi) along with MRE11 inhibitor Mirin or vehicle alone were administered during the HU incubation in the fork protection assay. d–f The distribution of CldU/IdU fiber ratios is shown with the horizontal lines indicating geometric mean of fiber ratios, with corresponding number for each group shown at the bottom of the graph. a–c P values from two-tailed Student's t-test are shown. d–f Statistical significance of each set of conditions was calculated using Kruskal–Wallis ANOVA test and comparisons between individual groups were calculated using Dunn’s multiple comparison post test. *p < 0.05, **p < 0.01; ***p < 0.001; ****p < 0.0001; ns: not significant. Representative data from three independent repeats are shown

