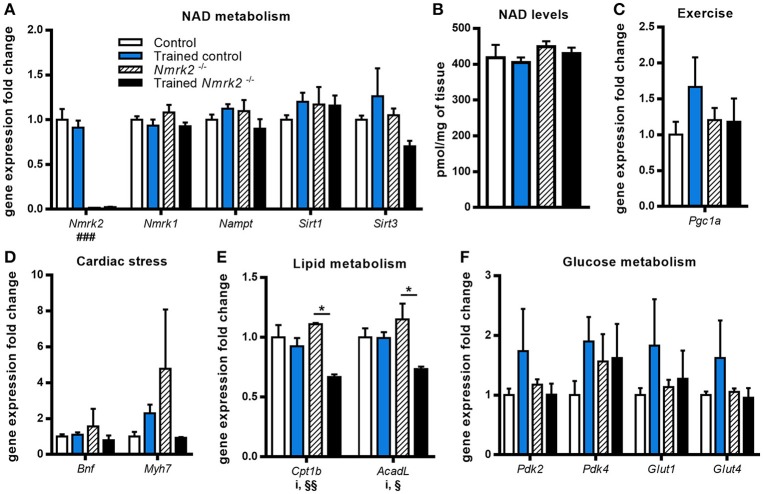
Figure 2.
Gene expression analysis and global NAD levels in left ventricle. (A) Relative quantification by RT-qPCR of Nmrk1, Nmrk2, Nampt, Sirt1, and Sirt3 mRNA levels in left ventricule. (B) Myocardial NAD levels. (C–F) Relative quantification by RT-qPCR of Pgc1α (C), Bnf and Myh7 (D), Cpt1b and AcadL (E), Pdk2, Pdk4, Glut1, and Glut4 (F) mRNA levels in left ventricule. n = 5 in control and trained control groups, n = 3 in Nmrk2−/− and trained Nmrk2−/− groups. Results are expressed as mean values ± SEM. Statistical analysis: two-way ANOVA for independent samples. ip < 0.05 for interaction, ###p < 0.001 for genotype effect, §p < 0.05 and §§p < 0.01 for endurance training effect. *p<0.05 from Tukey's multiple comparisons test when applicable.

