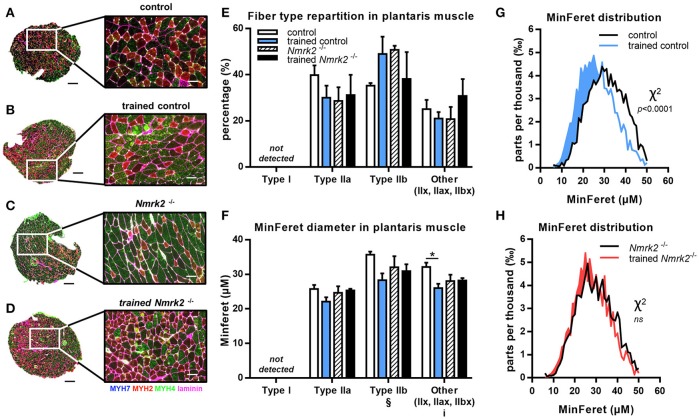
Figure 4.
MHC isoforms distribution and MinFeret diameter in plantaris muscle. (A-D) Myosin isoforms and laminin immunofluorescence histochemistry (MHC-I (MYH7) in blue, MHC-IIA (MYH2) in red, MHC-IIB (MYH4) in green, laminin in magenta) on 8-μm transversal cryosections of plantaris muscle from 18 weeks old mice, WT or Nmrk2−/−, sedentary or trained. Scale bars = 200 μm for whole muscle images, 60 μM for magnified images. (E) Fiber type proportions calculated from whole muscle sections. Fibers negative or mixed for Type I, IIA, or IIB MHC isoforms where assigned to a separated category, in comparaison to pure MHC isoforms positive fibers. (F) Fibers MinFeret diameter (μM). (G,H) Global MinFeret distributions whithin control and trained control mice (G), and Nmrk2−/− and trained Nmrk2−/− mice (H). n = 5 in control and trained control groups, n = 3 in Nmrk2−/− and trained Nmrk2−/− groups. Results are expressed as mean values ± SEM. Statistical analysis (E, F), two-way ANOVA for independent samples. ip < 0.05 for interaction, §p < 0.05 for endurance training effect. *p < 0.05 from Tukey's multiple comparisons test when applicable. (G,H), Chi-square test for MinFeret distribution comparisons.

