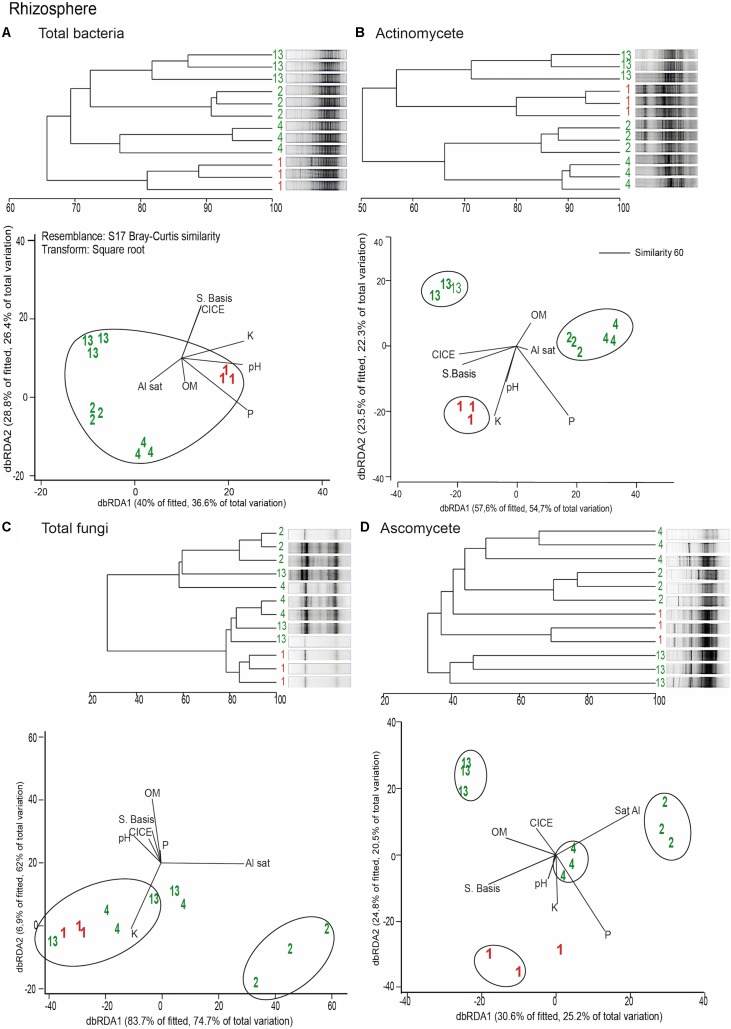
FIGURE 2.
Dendrograms and distance based redundance analyses (dbRDA) plots of the rhizosphere of wheat plants grown in conducive and suppressive soils, based on DGGE profiles of total bacteria (A), actinomycetes (B), total fungi (C), and ascomycete (D) and soil chemical parameters (P, K, OM, Al sat, CICE, and Σ basis). Soil parameters are represented with black lines in the dbRDA plots, the length and position represent the correlation (P < 0.05) with the endosphere microbial community composition. Red and green letters represent the endophytic community of wheat plants grown in conductive or suppressive soils, respectively.

