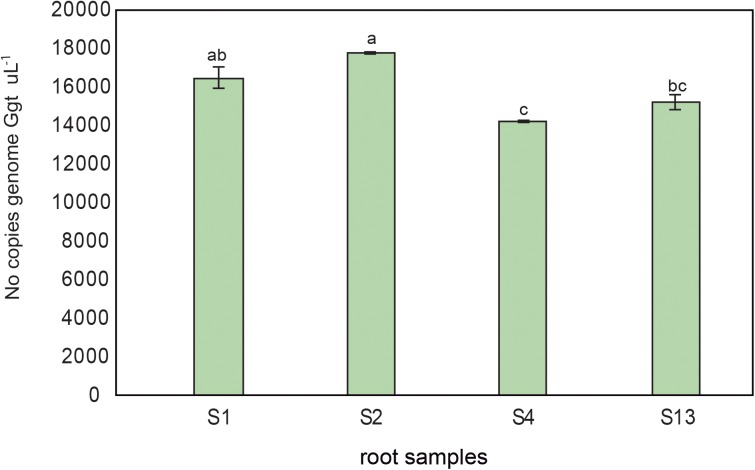
FIGURE 7.
Ggt DNA quantification by quantitative PCR (number of copies genome Ggt uL-1) in roots from wheat plants growing in conducive soil 1 (S1), or suppressive soils 2, 4, and 13 (S2, S4, and S13). Tukey test to compare treatments means, values followed by the same letter do not differ at P < 0.05 (n = 3).

