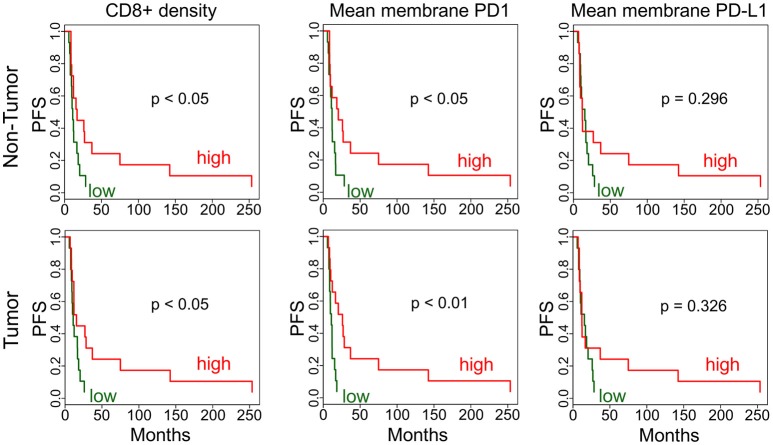
Figure 3.
Immunohistochemistry analysis of tumors and adjacent non-tumors. Kaplan-Meier plots are applied to analyze PFS associations in non-tumor and tumor for CD8+ phenotype density (counts/mm2) and mean membrane PD1 and PD-L1 expression. High (red) is the above median density/expression group, low (green) is below median.

