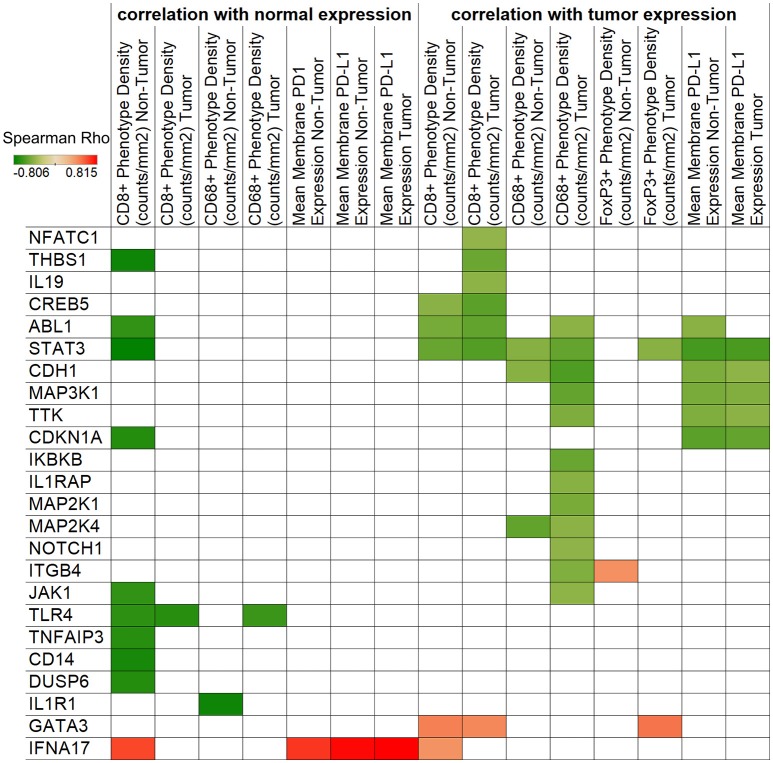
Figure 4.
Correlation of IHC and NanoString expressions. Spearman's rank correlation coefficients are represented by color for NanoString genes and IHC densities/expressions. The left side of the figure shows correlations with normal tissue gene expression, while the right side displays tumor expression associations. Only significant (p < 0.05) correlations are shown.

