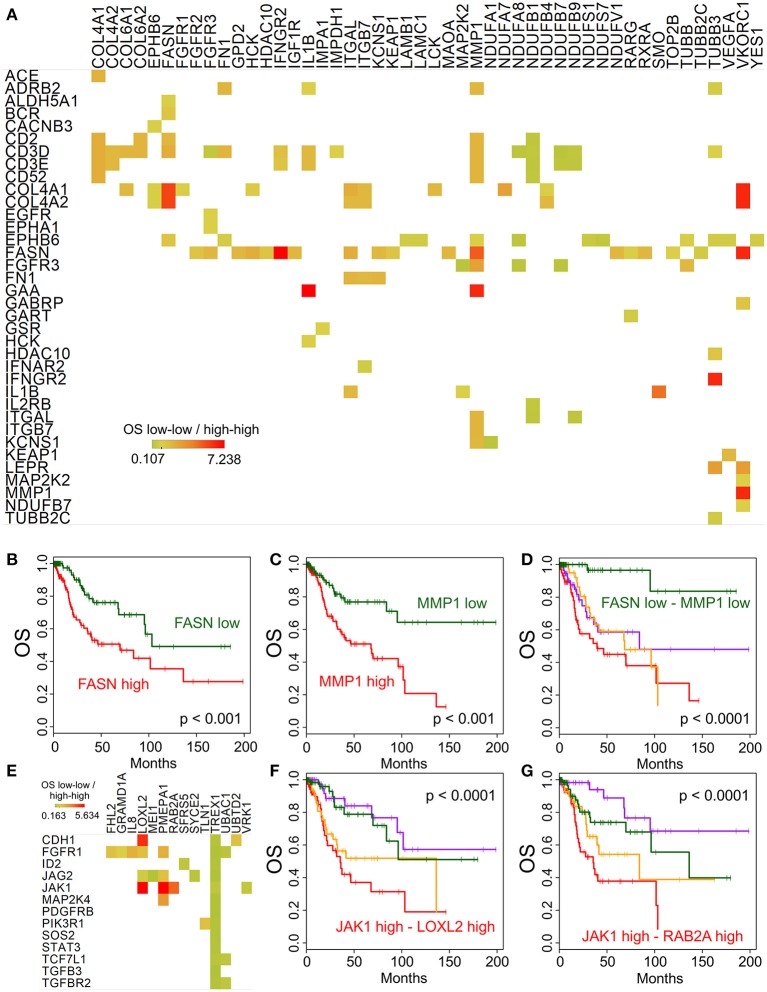
Figure 5.
Potential targets for combination therapies. Median overall survival ratio of low-low (both below median) and high-high (both above median) expression of gene pairs is depicted as shown by the color legend (A), only p < 0.0001 associations where median expression >5 TPM). Kaplan-Meier plots show the difference between high and low expression for FASN (B) and MMP1 (C) alone, and in combination (D). (E) Displays the overall survival ratio analysis results for the EMT genes (shown in rows) identified by our Ingenuity Pathway Analysis. The JAK1 - LOXL2 (F) and JAK1 - RAB2A (G) combination survival analyses are shown as examples.

