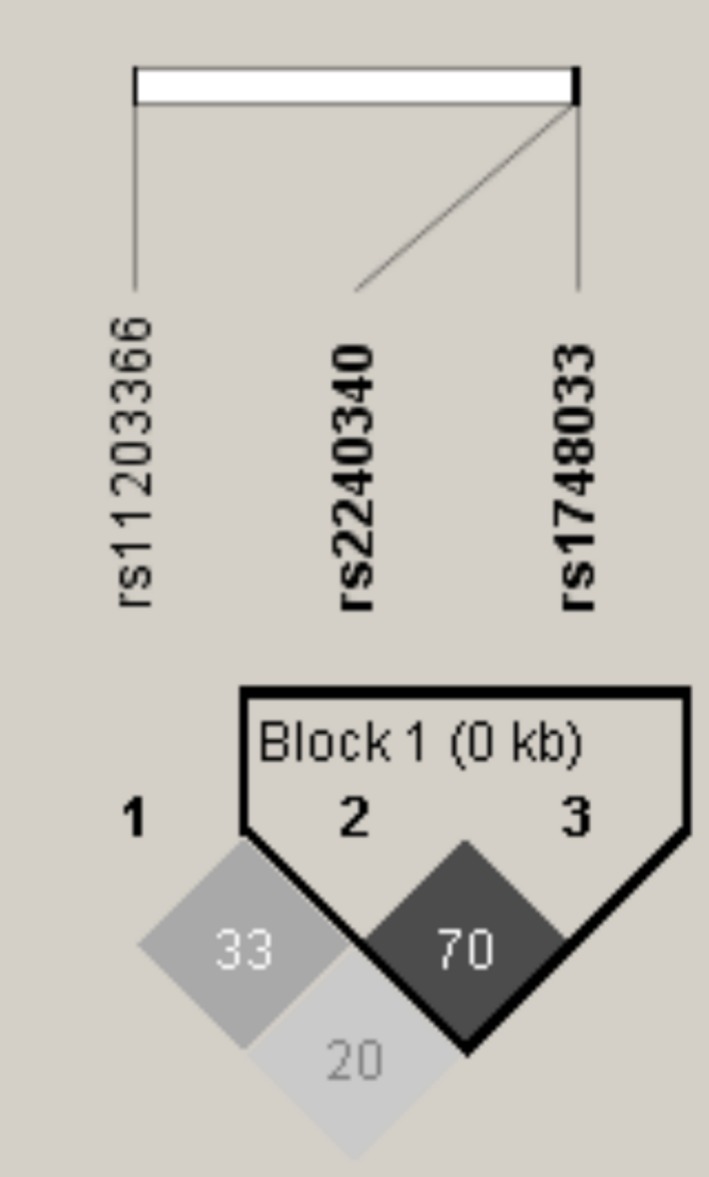
Figure 2.

Haploview plot of PADI4 gene SNP. Within each square is presented the pairwise correlation coefficient (r 2) LD plots white, (r 2 = 0), shades of grey, (0 < r 2 < 1), black, (r 2 = 1), and “rs” in bold refer to haplotype block

Haploview plot of PADI4 gene SNP. Within each square is presented the pairwise correlation coefficient (r 2) LD plots white, (r 2 = 0), shades of grey, (0 < r 2 < 1), black, (r 2 = 1), and “rs” in bold refer to haplotype block