
Figure 6.
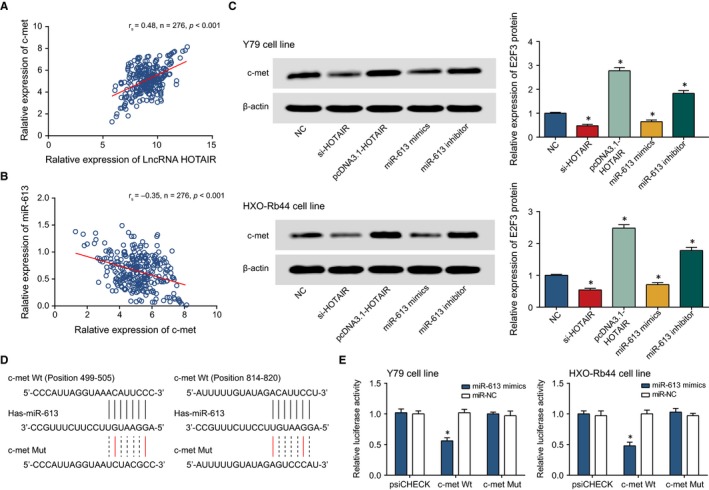
The Correlation Between miR‐613 and c‐met. A, HOTAIR expression was positively correlated with c‐met expression within retinoblastoma tissues. B, MiR‐613 expression was negatively correlated with HOTAIR expression within retinoblastoma tissues. C, The c‐met expression within Y79 and HXO‐Rb44 cell lines was compared among si‐HOTAIR, pcDNA3.1‐HOTAIR, miR‐613 inhibitor, miR‐613 mimic and NC groups. *: P < 0.05 when compared with NC. D, MiR‐613 was targeted by certain sites within c‐met. E, The luciferase activities of Y79 and HXO‐Rb44 cell lines were compared between miR‐613 mimic + c‐met Wt and miR‐613 mimic + c‐met Mut groups. *: P < 0.05 when compared with miR‐NC