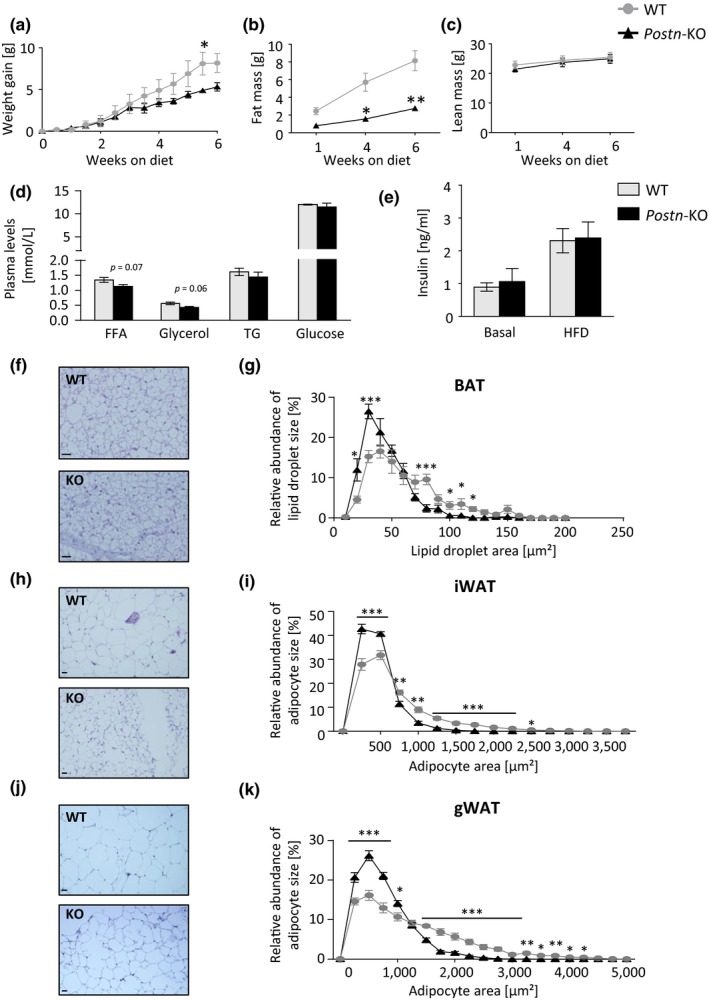
Figure 5.

Postn deficiency impairs adipose tissue expansion during high‐fat diet feeding. (a) Body weight gain of male WT and Postn‐KO animals during 6 weeks of HFD feeding. Gray lines/circles/bars represent WT controls, black lines/triangles/bars represent Postn‐KO mice, applies to all subsequent panels. (b, c) NMR analysis of male WT and Postn‐KO animals assessing total fat mass (b) and lean mass (c). (d) Plasma levels of FFA, glycerol, TG, and glucose in male WT and Postn‐depleted animals after 6 weeks of HFD. (e) Plasma levels of insulin with and without high‐fat diet feeding in male WT and Postn‐depleted animals. (f) Representative images of H&E staining (200× magnification; scale bar: 20 μm, applies to all subsequent images of BAT) of BAT of male WT (upper panel) and male Postn‐KO mice (lower panel). (g) Quantitative analysis of lipid droplet size in BAT sections after H&E staining of male WT and knockout animals after 6 weeks of HFD as shown in previous panel. (h) Representative H&E staining (100× magnification; scale bar: 20 μm, applies to all subsequent images of WAT) of iWAT of male WT (upper panel) and male Postn‐KO mice (lower panel). (i) Quantitative analysis of adipocyte size analysis of male iWAT comparing WT to Postn‐KO animals after 6 weeks of HFD from images as shown in previous panel. (j) Representative H&E staining (100× magnification) of gWAT of male WT (upper panel) and male Postn‐KO mice (lower panel). (k) Adipocyte size analysis of male gWAT comparing WT to Postn‐KO animals after 6 weeks of HFD from images as shown in previous panel. Data are shown as mean ± SEM (n = 5–7). *p < 0.05, **p < 0.01, ***p < 0.001 as assessed by two‐way ANOVA with Bonferroni post hoc test (a–c, g, i, k) and unpaired t test (d, e)
