Figure 5.
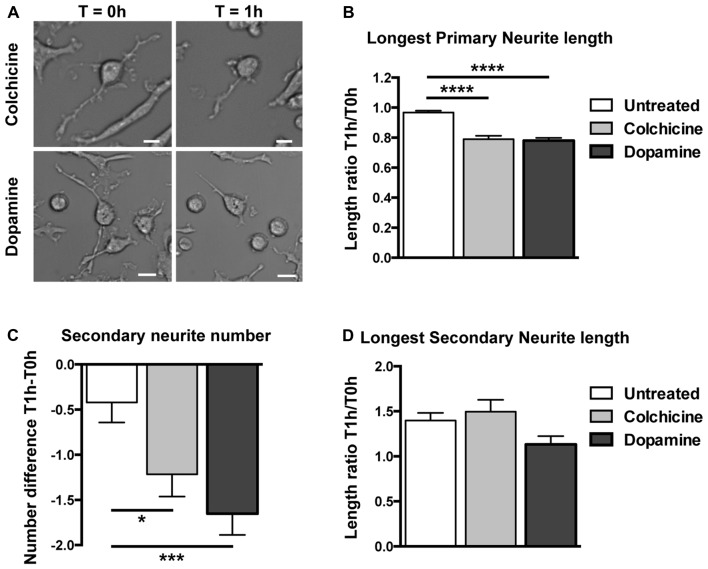
Structural responses to dopamine and colchicine exposure on human circulating monocytes transdifferentiated into neural-like cells. (A) Light microscopy photographs before and after treatment. The same cell was photographed before (T = 0 h) and after (T = 1 h) treatment with colchicine 0.5 μM (top), and another cell before and after treatment with dopamine 4 mM (bottom). Scale bars = 20 μm. (B) Bar graph showing a decrease in length of the longest primary neurite of transdifferentiated neuronal-like cells before and after different treatments. Data are expressed as ratios between the length of the longest primary neurite of each cell measured before (T0 h) and after (T1 h) treatment. The mean total length of the primary neurites at T = 0 h was 70 ± 30 μm. (C) Bar graph showing the number of secondary neurites of transdifferentiated neuronal-like cells. Data are expressed as the difference between the number of secondary neurites before (T0 h) or after (T1 h) treatment. The mean number of secondary neurites at T = 0 h was 6.0 ± 5.3. (D) Bar graph showing length of the longest secondary neurite on transdifferentiated neuronal-like cells before and after different treatments. Data are expressed as described in (B). The mean total length of the secondary neurites at T = 0 h was 12 ± 8 μm. Statistics are given mean ± SEM. n = 256 cells. Differences were assessed by one-way ANOVA. *P < 0.05, ***P < 0.001, ****P < 0.0001.

