Figure 4.

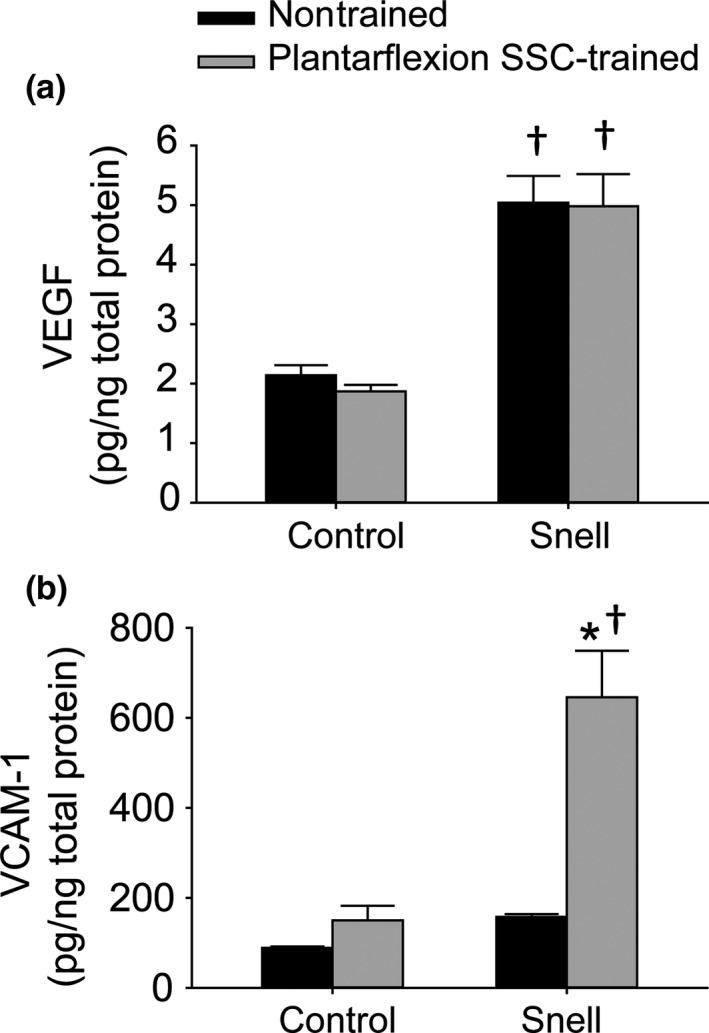
VEGF and VCAM‐1 protein levels within GTN muscle homogenates following plantarflexion SSC training. Sample sizes were N = 7 to 10 per group. Values are means ± SE. *Different from nontrained value; †Different from control value, p < 0.05

VEGF and VCAM‐1 protein levels within GTN muscle homogenates following plantarflexion SSC training. Sample sizes were N = 7 to 10 per group. Values are means ± SE. *Different from nontrained value; †Different from control value, p < 0.05