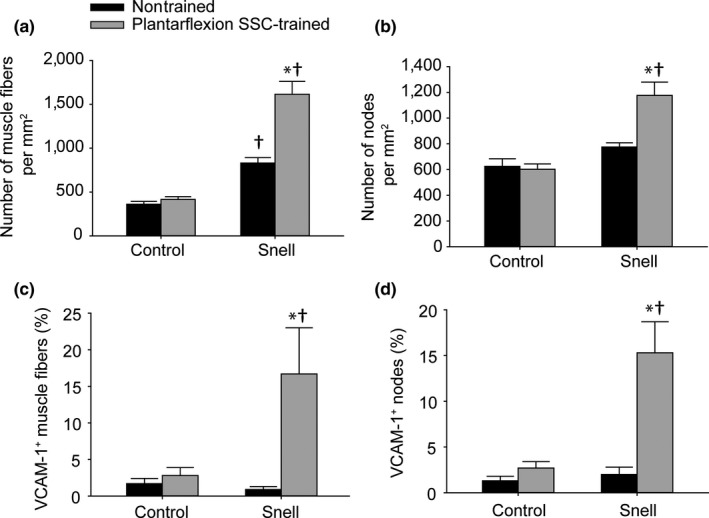
Figure 6.

The SSC‐induced increase in muscle fibers nodes per unit area and for Snell dwarf GTN muscles was accompanied by increased VCAM‐1+ staining. Total number of (a) muscle fibers and (b) nodes per muscle section area. Percentage of (c) muscle fibers and (d) nodes with VCAM‐1+ staining. Sample sizes were N = 5 to 6 per group. Values are means ± SE. *Different from nontrained value; †Different from control value, p < 0.05
