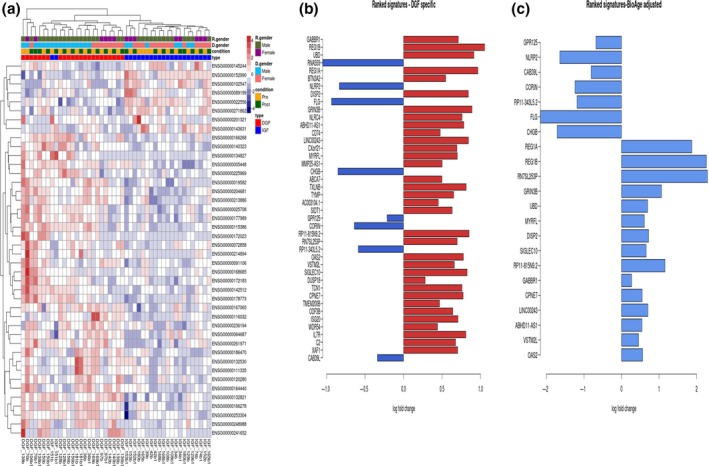
Figure 2.

Gene signatures associated with DGF after adjustment for ischaemia reperfusion injury (TOM4) presented as heatmaps, left panel (adjusted p‐value < 0.05). The expression counts were normalized by regularized log2 transformation. The phenotypic attributes associated with samples are mapped at the top of the plot. Preperfusion samples (B), postperfusion samples (B1). The right panel consists of top ranked DGF‐specific genes (adjusted p < 0.05) and the left panel consists of DGF signature after adjustment for BioAge. Two samples were excluded from the further analysis as they did not pass QA and QC control before bioinformatics analysis (106B and 39B1). R.gender: recipient gender; D.gender: donor gender; DGF: delayed graft function; IGF: immediate graft function
