Fig. 4.
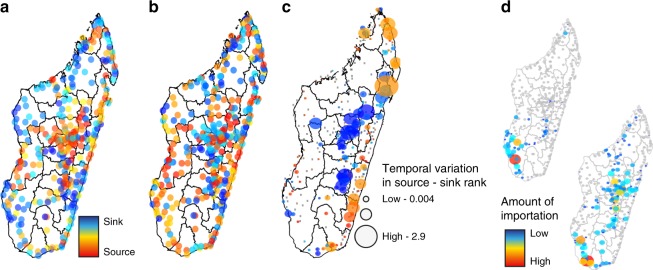
The sources and sinks of travel and parasite movement. We identified locations that were primarily sources versus sinks of a travel and b parasite movement for all communes included in the analysis. Sources and sinks of travel were geographically nearby, in contrast to the primary sink of parasites in the central highlands. c The temporal variability (coefficient of variation) in the source vs. sink rank over the time series of the data highlighting the most variable source and sink locations were along the East coast and in the central Highlands. d For two sample communes, Ampanihy and Betioky Sud, in the coastal region in Atsimo-Andrefana, the sink destinations are shown (locations with no importations are shown in grey). These two communes are similarly ranked sources. However, they differ both in terms of the number of sink locations and magnitude of importations at each sink location, suggesting that a more refined estimate of importation may be necessary to assess the impact of targeted interventions

