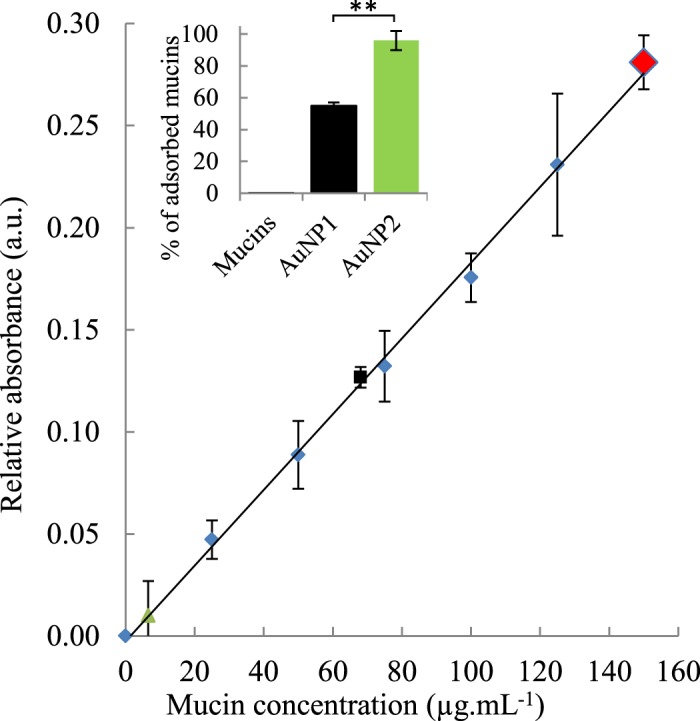
Figure 2.

Quantitative analysis of mucins adsorbed on gold nanoparticles. The calibration curve of mucins is represented by blue diamonds. The black square and the green triangle represent the percentage of mucins still free after the mix between, respectively, AuNP1 and AuNP2 (1 mg.mL−1) with an initial mucins concentration of 150 µg.mL−1 (red diamond). Insert: Histogram of the percentage of adsorbed mucins on AuNP1 and AuNP2 and the control of mucins alone. Data are reported as mean ± standard deviation, n = 3 (P-value < 0.01).
