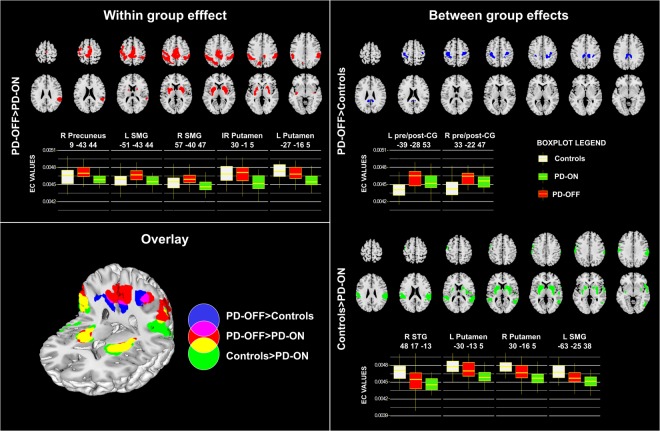
Figure 1.
Whole-brain eigenvector centrality group comparisons. Within group effect: EC reductions in PD-ON compared to PD-OFF. Between group effects: EC increases in PD-OFF compared to controls and EC decreases in PD-ON compared to controls. 3D overlay is shown. The boxplots show EC values in the peaks of significant clusters (x, y, z MNI coordinates). p < 0.05 FWE at cluster level. Brain images displayed in neurological convention (left hemisphere on the left of the image). Abbreviations: L: left; R: right; SMG: Supramarginal Gyrus; STG: Superior Temporal Gyrus; CG: Central Gyrus. Unthresholded results for the displayed contrasts can be found on NeuroVault https://neurovault.org/collections/3976/.

