
Figure 1.
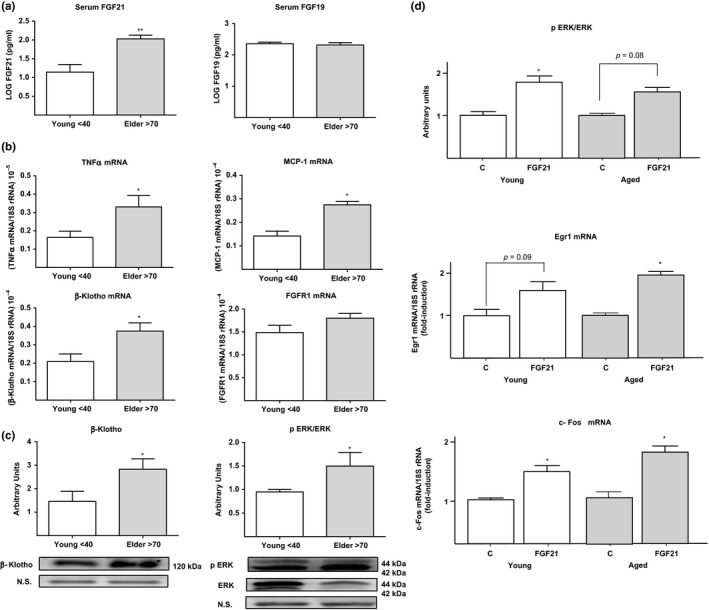
(a) Serum levels of FGF21 (left) and FGF19 (right) in young healthy controls (≤40) and elderly individuals (≥70). Serum levels of FGF21 and FGF19 are log‐transformed. (b) TNFα, MCP‐1, β‐Klotho, and FGFR1 mRNA expression in subcutaneous adipose tissue from young healthy controls and elderly individuals. Values are expressed relative to 18S rRNA (means ± SEM). (c) Levels of β‐Klotho protein (left) and ERK1/2 phosphorylation (right) in subcutaneous adipose tissue from young healthy controls and elderly individuals. Signal intensity was determined by densitometric quantitation of protein bands in immunoblot images (six individual samples per group). Phospho‐ERK1/2 levels were expressed relative to total ERK1/2. Membranes were stained with Coomassie Blue to normalize the amount of protein loaded. (d) Levels of ERK1/2 phosphorylation, Egr1 mRNA, and c‐Fos mRNA in mouse adipose tissue explants from young (5‐month‐old) and aged (16‐month‐old) mice treated with 30 nM FGF21 (four mice, triplicate explant analysis per mouse) and nontreated controls (c). All data are presented as means ± SEMs. *p < 0.05 and **p < 0.01 for comparisons between young healthy controls and elderly individuals, and FGF21‐treated vs. nontreated adipose explants