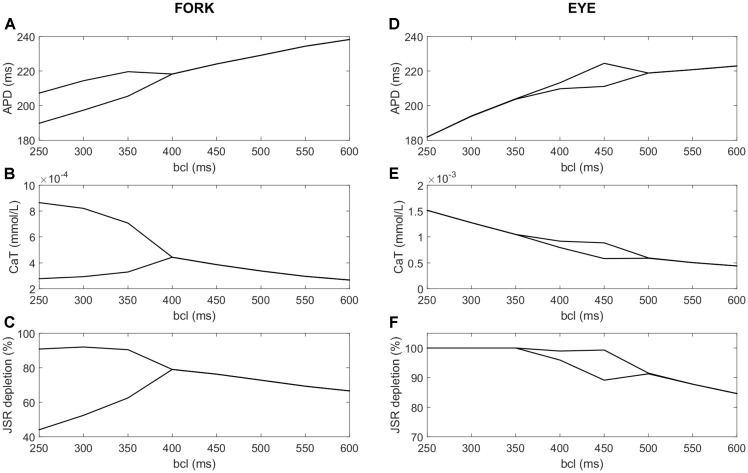
FIGURE 10.
A comparison of fork and eye-type alternans in the ORd model. The left column shows fork alternans in APD (A) and calcium transient amplitude (B), with underlying fractional JSR depletion per action potential (C), computed as:  , where min(CaJSR) is the minimum JSR contents per action potential and CaJSR, start is the starting JSR calcium concentration in the same action potential. In panels (D–F) are respectively shown APD, CaT, and depletion in eye-type alternans. All plots show the values of the two last action potentials for every bcl and variable of interest; bifurcation indicates that the last two action potentials differ in the variable of interest, manifesting alternans.

