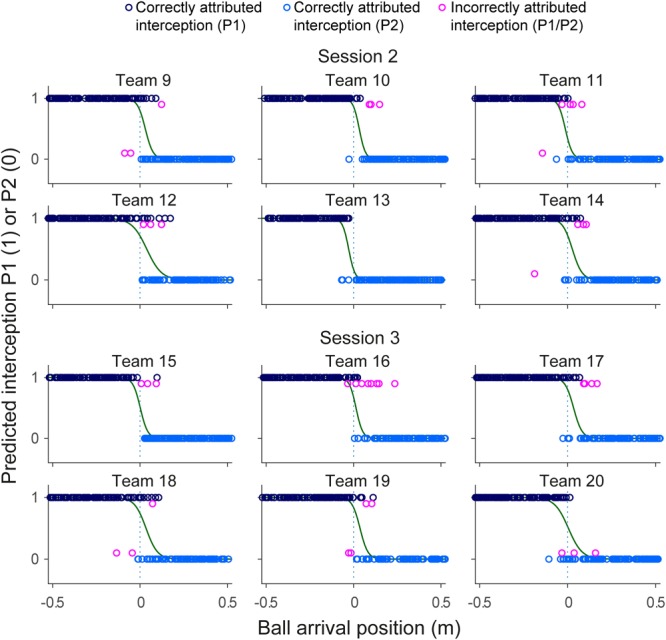
FIGURE 7.

Graphical summary of interception performance predicted by the action-based model predicted as a function of ball arrival position for all 12 teams separately. Ball arrival positions for correctly attributed interceptions are indicated by dark blue (P1 interception) and light blue (P2 interception) circles. Ball arrival positions of incorrectly attributed interceptions are indicated by pink circles with a slight vertical offset. The green curves depict the logistic curves representing the probability that LP (p = 1) or RP (p = 0) will intercept the ball as a function of ball arrival position. The horizontal dashed gray lines at ball arrival position 0 cm indicate the center of the interception axis.
