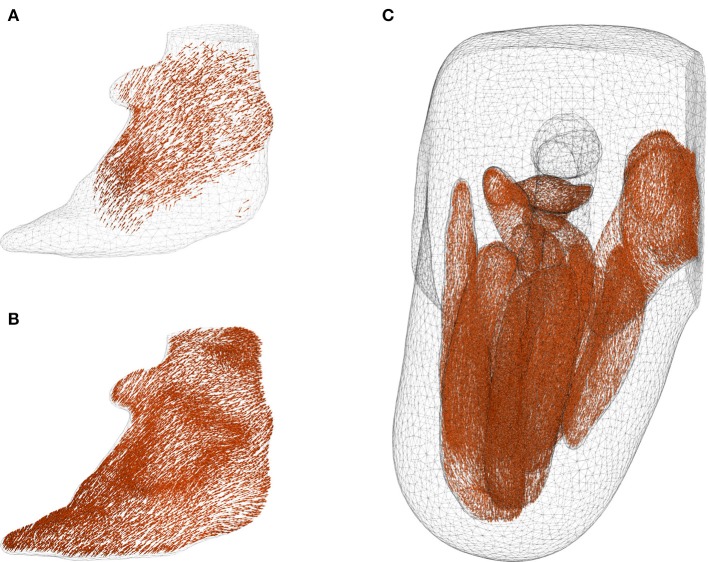
Figure 8.
Corrected fibre orientation. (A,B) show the fibres in Gluteus Maximus before and after interpolation using radial basis function, respectively. It can be seen that some boundary elements in (A) contained no fibre information. The inconsistent and missing fibres were corrected through the interpolation method proposed in section 2.2.3, and the resulting fibre distribution is shown in figure (B). Fibre orientation in the muscles are shown in (C) with femur, fat and liner suppressed for the sake of clarity.

