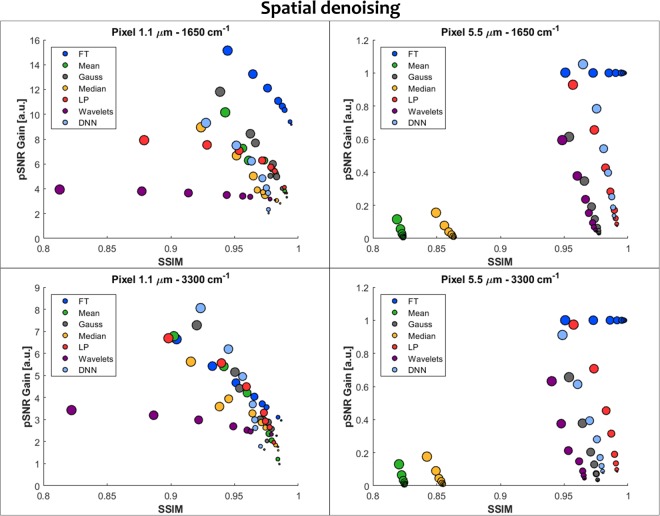
Figure 5.
A comparison of spatial denoising techniques as measured by pSNR Gain (normalized to pSNR of the input data) and SSIM for two different pixel sizes representing HD and standard definition imaging magnifications and two spectral bands of 3300 cm−1 and 1650 cm−1, corresponding to 3 and 6 µm wavelengths. Seven methods were tested: Fourier transform (FT), Mean Filter (Mean), Gauss Filter (Gauss), Median Filter (Median), Weighted Mean (W. Mean), spatial Wavelets (Wavelets) and Deep Neural Networks (DNN). The size of the dots corresponds to the initial noise level, starting with the highest noise for the largest dot (2 scans) and going down to the smallest (256 scans). The optimal parameters for each of the methods and noise levels are given in Supplementary Materials.

