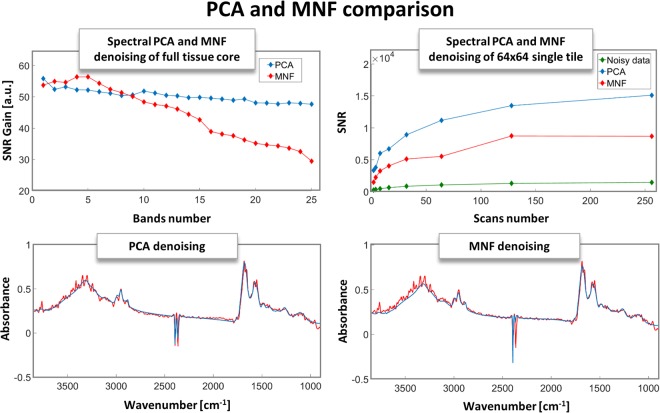
Figure 8.
(Upper left) Comparison of SNR Gains for PCA and MNF denoising with a different number of bands taken for reconstructions for an experimental whole tissue core shown in Fig. 7. (Bottom row) Single spectra taken from the same experimental pixel from Fig. 7. (Upper right) Actual SNR values of an experimental 2 to 256 scans of a single 64 × 64 tile of a tissue compared with PCA and MNF denoised values of the same image, showing the clear gain from denoising regardless of the actual number of scans.

