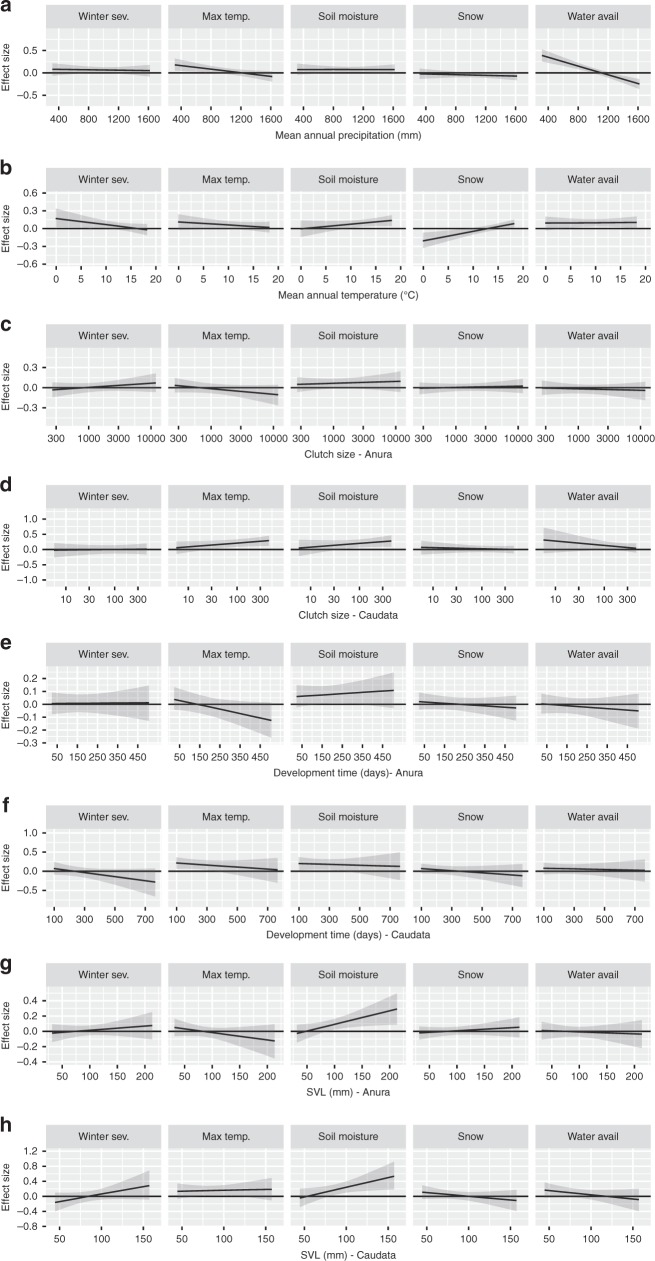
Fig. 4.
Climatic and life history differences in the relationships of climate variability to colonization and persistence probability. We estimated the relationship between annual conditions for five climatic drivers and species turnover and how it varies with respect to current climate (a, b) and life history traits (c–h). Effect size is on a logistic scale and represents the effect of a 1-SD change in the climate covariate on colonization and persistence. Error bars are the 95% credible interval for the estimate. Positive values indicate a location is more likely to be occupied in years after an increase in the climate covariate (higher colonization and persistence probability), whereas negative values are associated with declines in years with higher values. Plotted relationships for continuous variables show how the effect size of a given climate variable on colonization and persistence changes as the covariate changes. For example, greater water availability during breeding had a positive association with occupancy in the following year in sites with low mean annual precipitation and a negative effect in sites with high mean annual precipitation. Estimates and SE for effect sizes can be found in Table 1

