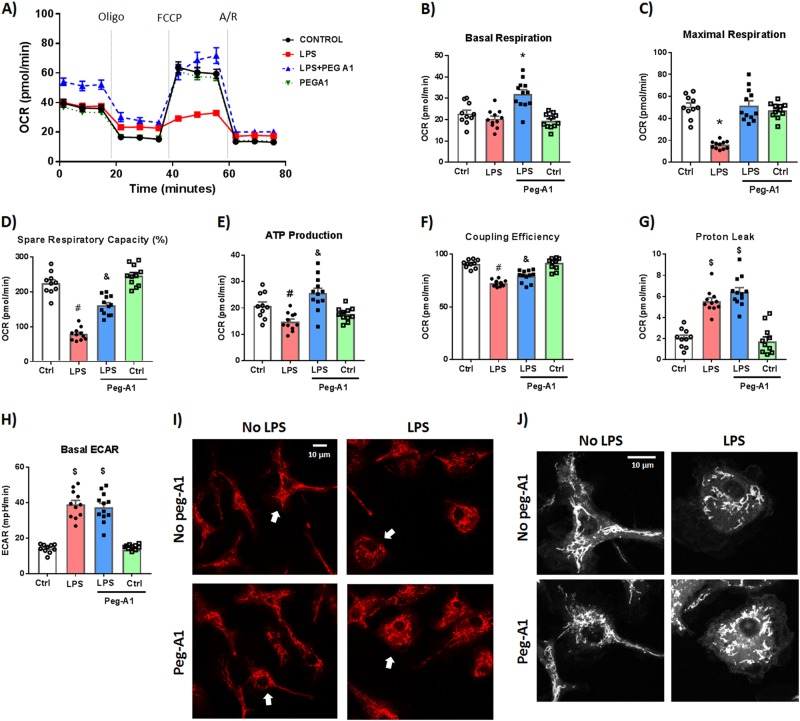
Fig. 7. PEG-A1 treatment protects against LPS-induced mitochondrial dysfunction in WT bone marrow-derived macrophages (BMDMs).
WT BMDMs were stimulated with LPS (100 ng/ml) for 24 h ± PEG-A1 (1 μg/ml). Seahorse XFe96 analyzer was used to evaluate mitochondrial function by measuring the oxygen consumption rate (OCR). a Change in OCR with time in response to Mito Stress test inhibitors (oligomycin, FCCP, and rotenone/antimycin A). b−g Mitochondrial respiration parameters were decreased with LPS treatment. PEG-A1 significantly rescued this decrease. *p < 0.01 vs. other three groups, $p < 0.01 vs. controls, &p < 0.01 vs. respective control, LPS, #p < 0.01 vs. respective control, and LPS + PEG-A1, n = 12 per group. Representative run from two independent experiments that showed the same results. h Extracellular acidification rate (ECAR), a measure of glycolysis, was increased with LPS stimulation but was not affected by PEG-A1 cotreatment, $p < 0.01 vs. controls, n = 12 per group. i WT macrophages under control condition or PEG-A1 treatment alone exhibited an elongated and interconnected mitochondria (stained with Rhodamine 123). LPS-induced mitochondrial fragmentation and localization around the nucleus consistent with a round activated macrophage morphology. PEG-A1 cotreatment of LPS-stimulated macrophages partially reversed the LPS effect. j Magnification of cells denoted by arrows in panel (i). Images were converted to black and white for clarity. Scale bar = 10 μm

