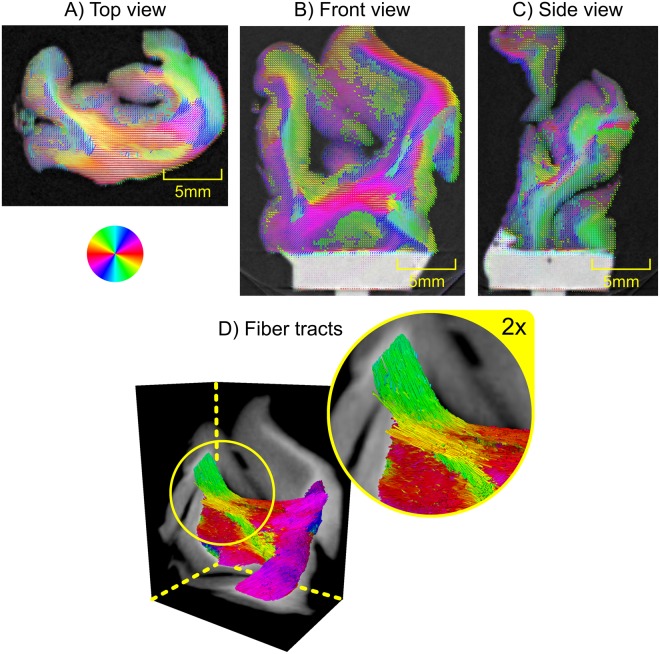
Figure 3.
(A–C) Three slices of the attenuation X-ray CT overlaid with the fiber tract orientations as produced by our approach of Anisotropic X-ray Dark-field Tomography (AXDT). The coloring shows the in-plane orientation according to the color-wheel at the top left. In (D) we display three cross-sections of the 3D attenuation X-ray CT overlaid with the fiber tracts within the white matter as computed with a streamline method. The coloring was chosen based on the orientation of the tracts projected onto the plane orthogonally to the viewing direction according to the color-wheel.

