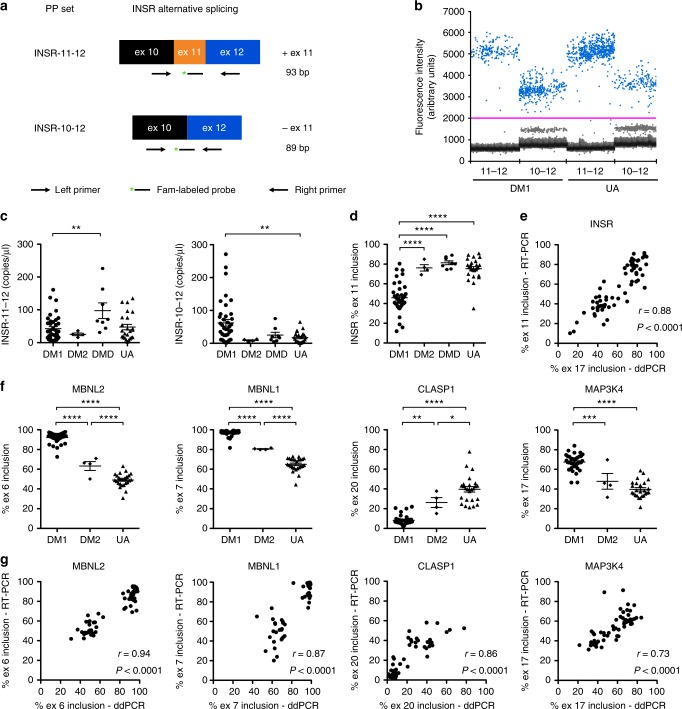
Fig. 5.
Droplet digital PCR (ddPCR) analysis of alternative splicing in human urine exRNA. We used ddPCR to examine splicing of INSR exon 11 in urine exRNA samples from DM1 (N = 37), DM2 (N = 4), DMD/BMD (N = 8), and UA controls (N = 25). a Assay design using separate primer probe (PP) sets to identify exon 11 inclusion (INSR-11-12; amplicon size 93 base pairs, “bp”) and exon 11 exclusion (INSR-10-12; amplicon size 89 bp). b Representative droplet populations in urine exRNA samples from DM1 and UA subjects (N = 4 each) using each assay (INSR-11-12 and INSR-10-12). c Quantification of INSR splice products that include exon 11 (left) and exclude exon 11 (right) as copies per microliter cDNA. Individual data points represent the mean of duplicate assays for each sample. Error bars indicate mean ± s.e.m. **P = 0.0015 (DM1 vs. UA); *P = 0.01 (DM1 vs. DMD). d Calculation of INSR exon 11 inclusion using data in c. Error bars indicate mean ± s.e.m. ****P < 0.0001 (DM1 vs. DMD/BMD) and (DM1 vs. UA) groups. e INSR exon 11 inclusion measured by ddPCR (x-axis) vs. RT-PCR (y-axis) in all subjects. The correlation coefficient r and P value are shown. f Exon inclusion percentages for MBNL2 exon 6, MBNL1 exon 7, CLASP1 exon 20, and MAP3K4 exon 17. Error bars indicate mean ± s.e.m. ****P < 0.0001 (all four transcripts, DM1 vs. UA), (MBNL2 and MBNL1, DM1 vs. DM2), and, (MBNL1, DM2 vs. UA); *** mean difference 14.2, 95% CI of difference 6.2–22.1 (MBNL2, DM1 vs. DM2), and mean difference 20.1, 95% CI of difference 9.0–31.2, (MAP3K4, DM1 vs. DM2); ** mean difference 17.9, 95% CI of difference 5.5–30.3, (CLASP1, DM1 vs. DM2); * mean difference 13.2, 95% CI of difference 0.4–26.4, (CLASP1, DM2 vs. UA); one-way ANOVA. g Exon inclusion of MBNL2, MBNL1, CLASP1, and MAP3K4 measured by ddPCR (x-axis) vs. RT-PCR (y-axis) in all subjects. The correlation coefficient r and P values are shown

