Fig. 9.
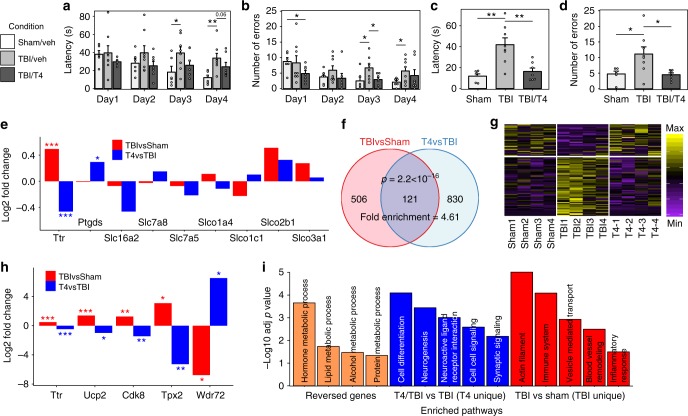
Validation of T4 treatment effects. a, b T4 treatment effects on learning through measurement of latency (a) and number of errors (b). c, d T4 treatment improves memory through measurement of latency (c) and number of errors (d) in Barnes Maze test. Bargraphs display mean values with error bars representing the standard error of the mean. Two-sided t-test was used to determine significance. e Ttr is the primary thyroid hormone transporter responsive to TBI and T4 treatment compared to other known transporters. f–h Gene expression profiles of T4 treatment experiments. f TBI and T4 treatment show significant overlap in DEGs. Signficance in overlap was determined using Fisher’s exact test. g Heatmap showing T4 reversed the expression patterns of 93 TBI-affected genes. h Examples of TBI genes reversed by T4. Significance of DEGs between the two conditions in e and h is determined by the negative binomial model, and the log2 fold change between two conditions based on the average gene expression values of the two groups was plotted on the y-axis. i Enriched pathways among the 93 TBI DEGs reversed by T4, pathways unique to T4 treatment (T4/TBIvsTBI) and those unique to TBI (TBIvsSham). Enrichment of pathways were determined using Fisher’s exact test with Bonferroni corrected p values used for statistical significance. Adjusted *p < 0.05, **p < 0.01, ***p < 0.001. Error bars are s.e.m. Sample size: a–d Sham/Veh: n = 6, TBI/Veh: n = 8, TBI/T4: n = 7; e, h n = 4/group

