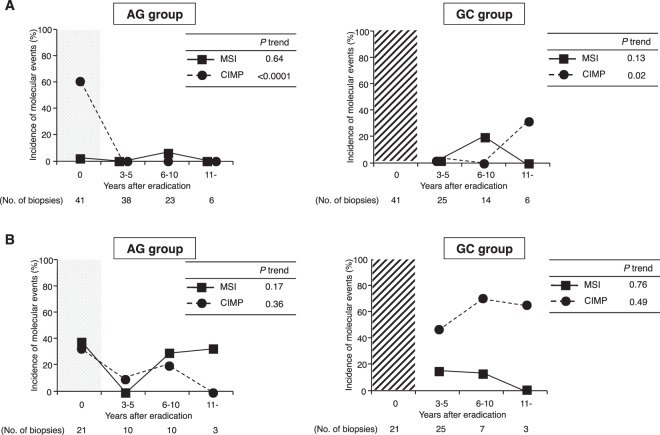
Figure 1.
Changes of MSI and CIMP in the AG and GC groups. (A) The data points within the shaded t = 0 region indicate the Hp group. In non-IM, both MSI and CIMP have mostly disappeared after H. pylori eradication in the AG group. The incidence of CIMP increases gradually, but does not show a significant change in the GC group. (B) In IM, the incidence of MSI and CIMP do not show significant changes after treatment in the AG group. The incidence of CIMP remains persistently high in the GC group.

