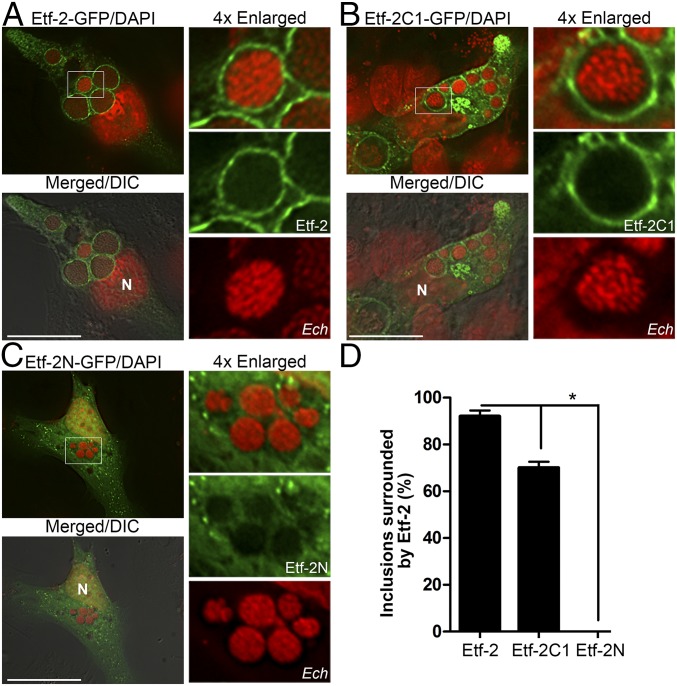
Fig. 2.
Ectopically expressed full-length Etf-2 and its C-terminal fragment, but not the N-terminal fragment, traffic to Ehrlichia inclusions. (A–C) Ehrlichia-infected RF/6A cells at 1 dpi were transfected with Etf-2-GFP (A), Etf-2C1-GFP (B), or Etf-2N-GFP (C). At 15 hpt [39 h postinfection (hpi)], cells were fixed and stained with DAPI for DNA (pseudocolored red). Merged/DIC, the fluorescence image is merged with the DIC image; N, nucleus. Each boxed area is enlarged 4× on the right. (Scale bars: 10 µm.) (D) Quantification of the localization of Etf-2, Etf-2C1, or Etf-2N-GFP to 120 Ehrlichia inclusions in 20–30 transfected cells from three independent experiments. Data are presented as the mean ± SD. *P < 0.05, ANOVA.

