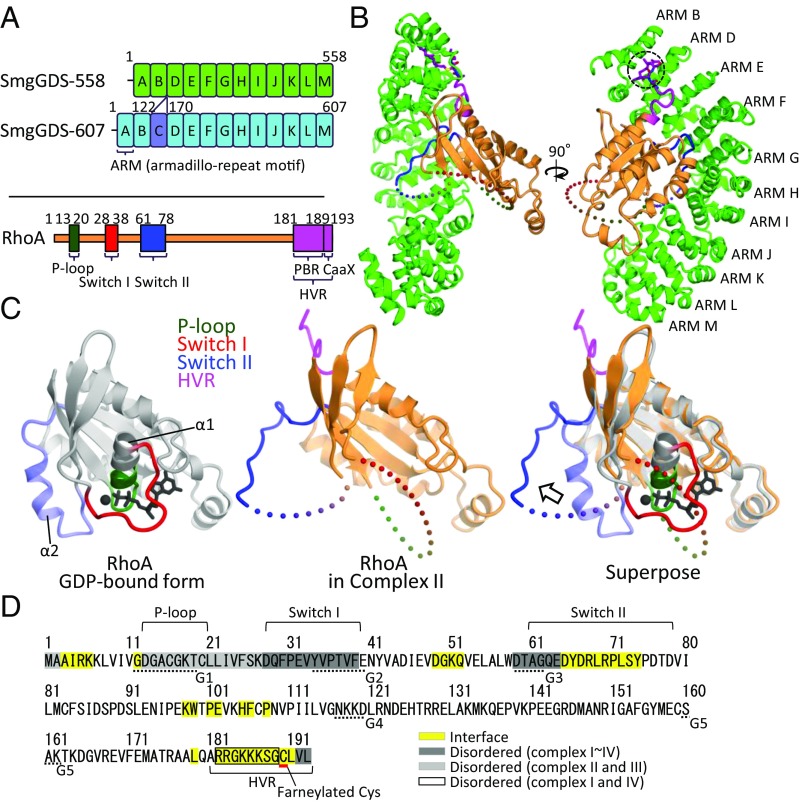
Fig. 1.
Structure of the SmgGDS-558/farnesylated RhoA complex. (A) Domain architectures of two SmgGDS isoforms and RhoA. ARM repeats of SmgGDS-558 and -607 except ARM C are shown in green and sky-blue boxes labeled ARM A–ARM M. ARM C is colored in violet. RhoA is shown in orange, and the three nucleotide recognition domains (P loop, switch I, and switch II) are shown in dark green, red, and blue, respectively. C-terminal HVR is shown colored in purple. The numbering schemes used are also shown. (B) Crystal structure of SmgGDS-558/farnesylated RhoA. SmgGDS-558 and RhoA are shown as a ribbon and surface model. C190 (S-farneylated) and L191 of RhoA are shown as a stick model and enclosed by a dotted circle. (C) Comparison of RhoA structure. Core domain of GDP-bound RhoA (PDB ID code: 1FTN) and RhoA located in complex II are colored in gray and orange, respectively (Left, Middle). Three nucleotide recognition domains (P loop, switch I, and switch II) and HVR are colored in green, red, blue, and purple, respectively. Superposition of these two structures is shown on the Right, and the arrows represent the movement of switch II. α1 and α2 helices of RhoA are labeled. (D) Interface and disordered region of RhoA in complex with SmgGDS-558. The protein–protein interface is highlighted in yellow. The interface was calculated by PISA. The amino acid residues were found to be disordered; complexes II and III, and complexes I and IV are highlighted in a light gray and black square, respectively. The amino acids that compose G boxes are underlined with a dotted line.

