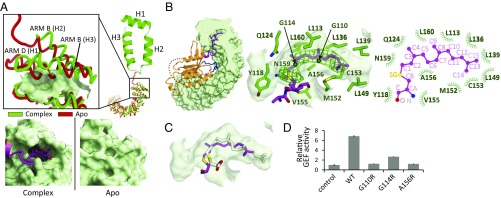
Fig. 4.
Farnesyl group of RhoA C190 inserted into the cryptic pocket of SmgGDS-558. (A, Left) Typical ARM and movement of α-helices of SmgGDS-558, as determined by making a complex with farnesylated RhoA. A typical ARM (H1–3) is shown as a ribbon model. Apo and RhoA-bound form of SmgGDS-558 are shown in red and green, respectively. Enlarged view of the N-terminal ARMs is shown (Inset). The surface of the cryptic pocket is shown. (A, Right) Enlarged view of surface models of SmgGDS-558 apo and complex forms. (B) Cross-section (Left) and enlarged views (Middle) of the insertion of farnesyl group of RhoA C190 into SmgGDS-558. RhoA is shown in orange using the ribbon model. C190 (S-farnesylated) and L191 of RhoA are shown as stick models. Molecular surface of SmgGDS-558 is shown in gray and side chains of SmgGDS-558, which form the pocket, are shown as a green stick model. The electron density map (mFo–DFc) of the side chain of S-farnesylated C190 contoured at 2.5 σ is shown in green mesh. Schematic representation of interactions between C190 and SmgGDS-558 (Right). (C) Docking model of S-geranylgeranylated cysteine to the crystal structure. Docking model of S-geranylgeranylated cysteine is shown as a white stick model. (D) GEF assay of SmgGDS-558 and its mutants interfering with the lipid binding for farnesylated RhoA. Guanine nucleotide dissociation was measured by monitoring fluorescence from BODYPY-GDP bound RhoA. The same assay was performed three times. The relative GEF activity and its SE are shown in bar chart.

