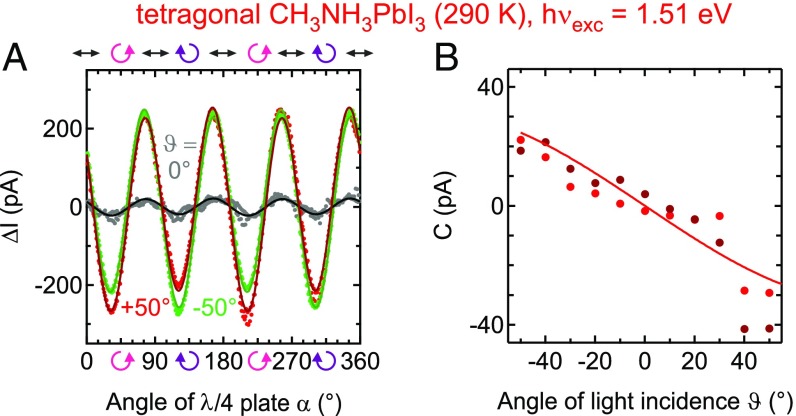
Fig. 2.
Changes in the photocurrent with light polarization. (A) The photocurrents measured as a function of light polarization for three different angles of light incidence: (red symbols), (green symbols), and (gray symbols). Pure linear (black arrows) and circular polarizations (pink and purple curved arrows) are indicated. Curves depict fits to the data using Eq. 1. (B) The CPE amplitudes extracted from fits to the data in A. The curve is a sinusoidal guide to the eye. Light and dark red symbols represent data recorded with a parallel beam (laser power: 5 W) and a focused beam (40 W).

