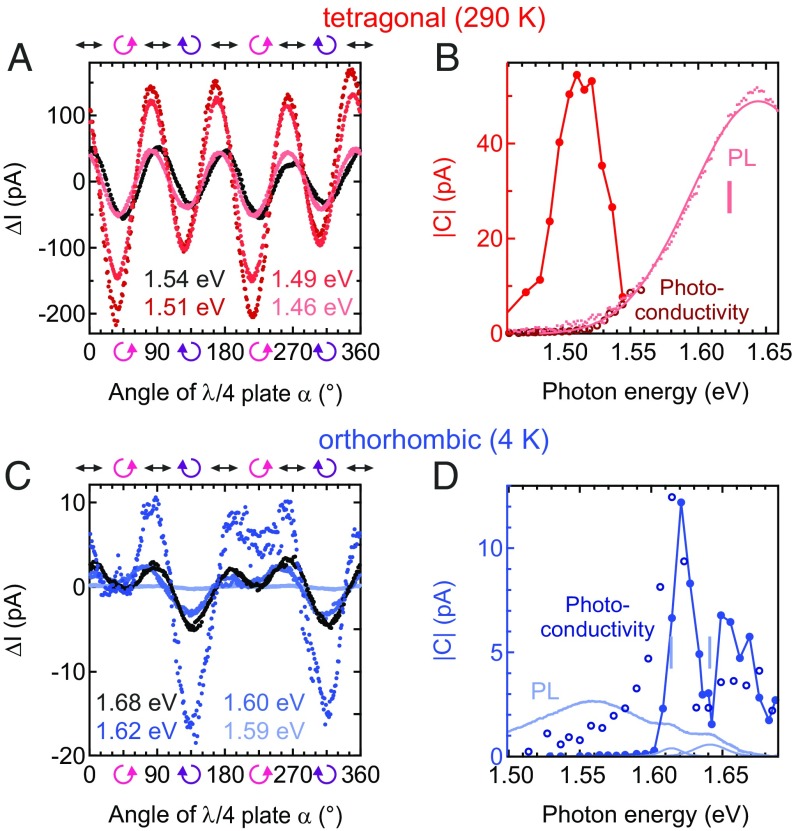
Fig. 3.
Changes in the photocurrent as a function of the excitation photon energy. (A and C) Raw data for the tetragonal phase (excitation power: 40 W) and the orthorhombic phase (8 W) recorded for . Extracted CPE amplitudes are shown as solid symbols in B and D. Open symbols in B and D depict the photoconductivity. Photoluminescence (PL) spectra are given as pink and light blue dots together with fit functions (solid curves). Vertical bars indicate the positions of the PL peaks.

