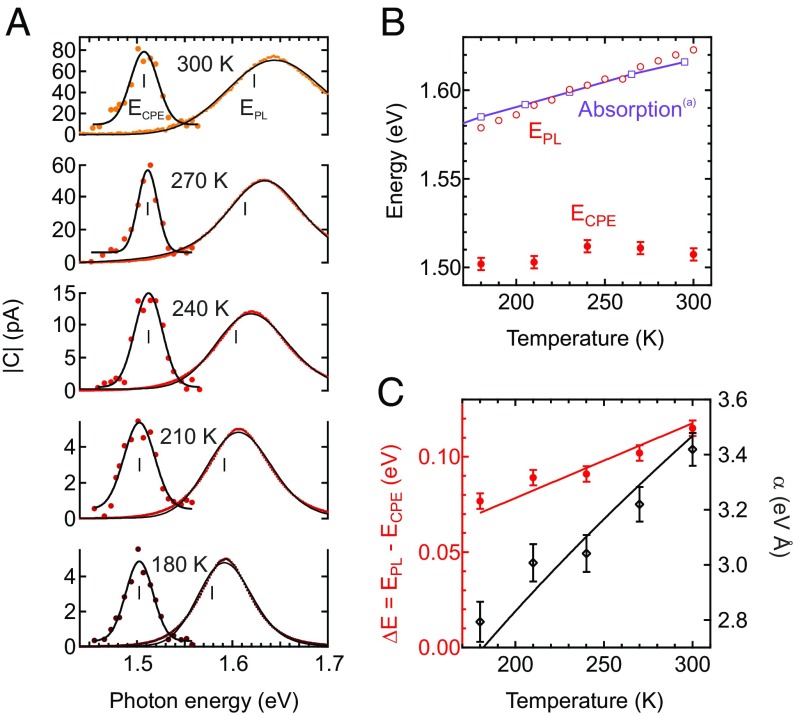
Fig. 5.
Temperature-dependent energy splitting between the direct and the spin-polarized transitions. In A, the spectral response of the CPE and the photoluminescence emission are compared for different temperatures. The peak positions extracted from fits to the data (solid red curves) are indicated by tick marks in A and summarized in B. The direct band gap of () thin films measured in transmission (69) is shown in purple for comparison. (C) The energy splitting between the two transitions and the estimated sum of the Rashba parameters of the valence and conduction bands. Solid red and black lines depict their temperature dependences within an analytical model (70). ; laser power, 4 W. (a) is from ref. 69.

