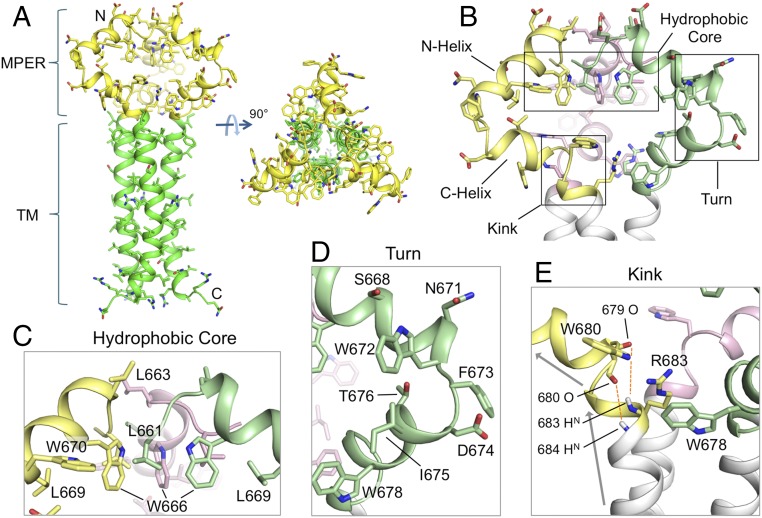
Fig. 1.
Structure of the MPER-TMD of HIV-1 Env. (A) Ribbon representation of the average structure of the calculated ensemble. The MPER (residues 660–683) and the TMD (residues 684–710) are shown in yellow and green, respectively. (B) A close-up view of the MPER trimer showing the three protomers in different colors, as well as the characteristic features including the N- and C-helices, the hydrophobic core, the turn connecting the N- and C-helices, and the kink between the C-helix and TMD. (C) The “hydrophobic core” consisting of N-helix hydrophobic residues (W666, W670, L661, and L669). (D) The “turn” region containing residues 671–676. (E) The “kink” at residues 680–683 resulting in a ∼45° change in helix orientation (indicated by the arrows). The O(i)−HN(i + 4) distances of 679–683 and 680–684, indicated by red dashed lines, are >5 Å, much greater than a standard hydrogen bond distance (∼2.5 Å).

