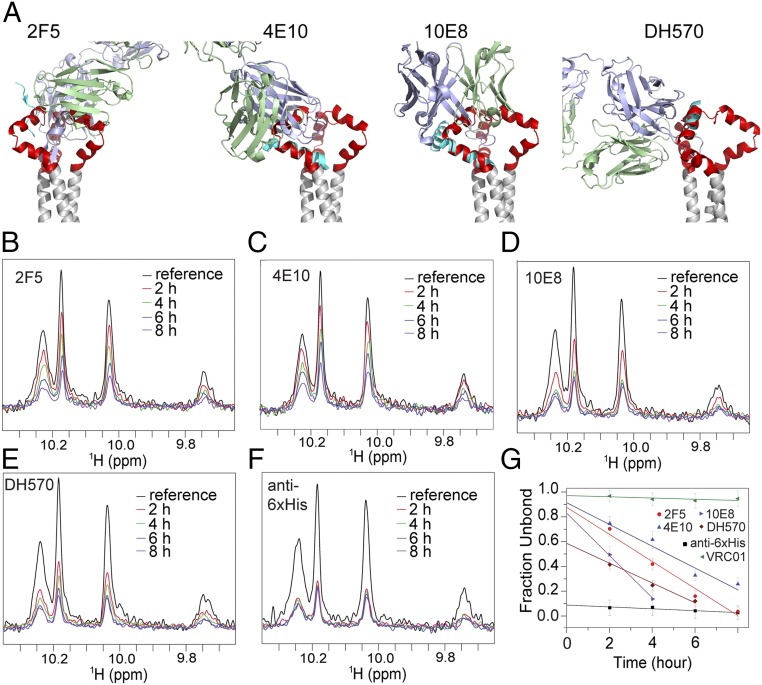
Fig. 3.
Antibody accessibility of the MPER-TMD in bicelles. (A) The MPER-TMD structure, superposed on crystal structures of the MPER epitope peptides in the complex with their corresponding antibodies, 2F5 [PDB ID code 1TJH (20)], 4E10 [PDB ID code 2FX7 (71)], 10E8 [PDB ID code 4G6F (12)], and DH570 [PDB ID code 5DD0 (44)]. Antibody heavy and light chains are in blue and green, respectively; the epitope peptides are in cyan, the MPER trimer in red, and the TMD in gray. (B) Binding of the MPER-TMD to 2F5 Fab was monitored by loss of NMR signal (due to rapid signal relaxation upon Fab binding). The 1D 1H-15N TROSY-HSQC spectrum of the tryptophan indole amines was recorded for the MPER-TMD in bicelles (q = 0.55) at various time points, shown in different colors, after addition of 2F5. The reference spectrum in black was recorded without 2F5. The MPER-TMD:antibody molar ratio was 1.0:0.7. (C–E) Same as in B performed for the 4E10, 10E8, and DH570 Fabs, respectively. (F) Same as in B performed for the anti-6xHis Fab (prepared from antibody MA1-21315) using the MPER-TMD with an N-terminal 6xHis tag. (G) Fraction of Fab not bound to the MPER-TMD at various time points, calculated as (I − 0.3)/(I0 − 0.3), where I0 is the reference peak intensity normalized to 1, I is the fraction peak intensity at a particular time relative to I0, and subtraction of 0.3 corrected for the 30% molar excess of MPER-TMD in the mixture. The y axis intercepts indicate the fraction of the MPER-TMD in a conformation that is incompatible with antibody binding. The essentially flat line for VRC01 shows little or no binding to MPER, as expected.

