Fig. 1.
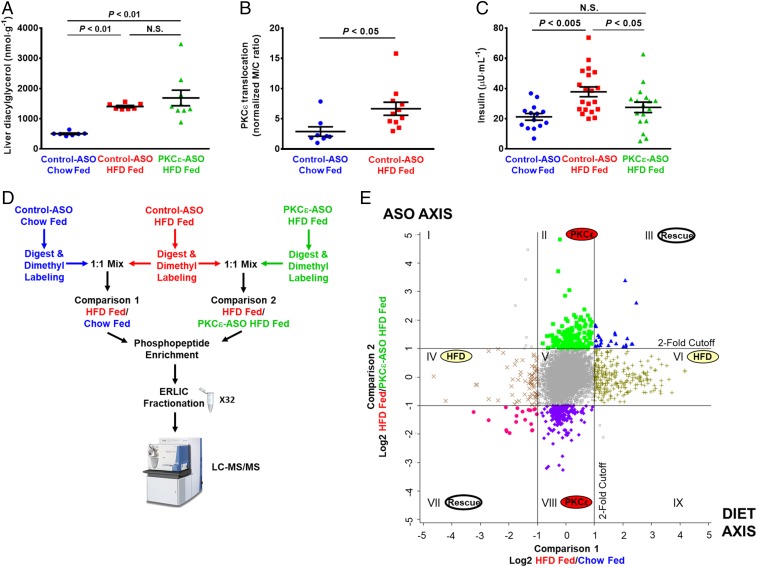
Quantitative phosphoproteomic analysis of acute hepatic insulin resistance and rescue by PKCε knockdown. Rats were fed either a control, chow diet or a HFD and treated with ASO that was either scrambled (control ASO) or targeted to PKCε (PKCε ASO). (A) HFD resulted in increased liver diacylglycerol independent of PKCε ASO. (B) PKCε translocation was quantified as a marker of PKCε activity [membrane-to-cytosol (m/c) ratio]; from immunoblot in SI Appendix, Fig. S1E. (C) HFD feeding increased basal plasma insulin, which was rescued by PKCε ASO. (D) Phosphoproteomics workflow, indicating three experimental groups and two pairwise comparisons. Phospho-enriched samples were separated into 32 fractions by ERLIC to reduce sample complexity and increase proteomic coverage; three technical replicates of each fraction were analyzed by LC-MS/MS using a 120 method (three replicates of 32 fractions = 96 120-min runs). (E) Effect of HFD and PKCε knockdown on the phosphoproteome. Phosphopeptide ratios obtained from two technical replicates of each comparison were averaged and log2 transformed, and peak intensity ratios were plotted against each other. The y axis represents the effect of the PKCε ASO on the phosphoproteome, whereas the x axis represents the effect of the HFD on the phosphoproteome; the lines represent twofold change in the phosphopeptide ratio. The twofold cutoff lines designate 2D enrichment categories of phosphopeptides that are designated by roman numerals. Error bars represent mean ± SEM (A–C).

