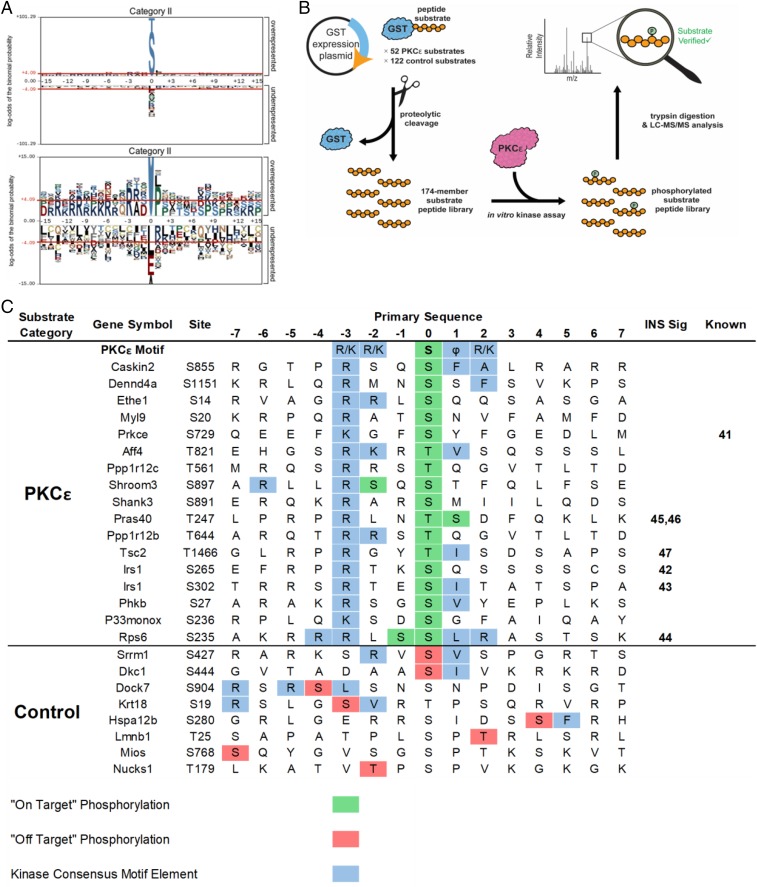
Fig. 3.
Motif analysis and mass spectrometry-based kinase assays identify previously unknown PKCε substrates. (A) Motif analysis of phosphopeptides from category II revealed a PKC-like motif (RxxS/T). Residues shaded in gray are fixed, while the size of the residue correlates with the enrichment of that residue at a position. Residues above the red lines are statistically significant (P < 0.05). (B) Workflow for kinase–substrate relationship determination using a substrate peptide display library. Substrates were selected based on phosphoproteomic data and PKC motif analysis, expressed as a C-terminal fusion to GST in E. coli, purified, and cleaved from the GST. The peptide substrate display library was incubated with PKCε and digested with trypsin; peptide substrates that were phosphorylated were identified by LC-MS/MS followed by database searching. (C) PKCε substrates identified by substrate peptide display library. The amino acid sequence of each substrate peptide is shown with the site of in vivo phosphorylation at position 0 with 7 aa flanking. “On-target” phosphorylation (in green) indicates the site of in vivo and in vitro phosphorylation matched. “Off-target” phosphorylation (in red) indicates phosphorylation by PKCε at unintended sites. PKCε motif elements are shown in blue. References are included for known members of the insulin signaling pathway (INS Sig) and for known kinase–phosphosite relationships (Known).

