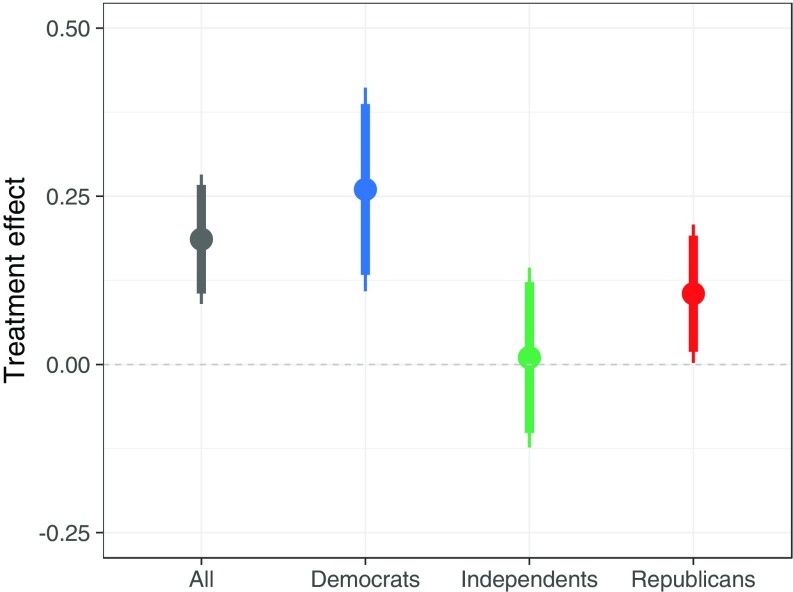
Fig. 2.
Average treatment effect of perspective taking on the full sample (gray), the subsample of Democrats (blue), the subsample of Independents (green), and the subsample of Republicans (red). Bars show 90% and 95% confidence intervals. Wave 1 sample is shown. All graphs show treatment effects based on an OLS regression estimating Eq. 1 on various subsamples.

