Fig. 4.

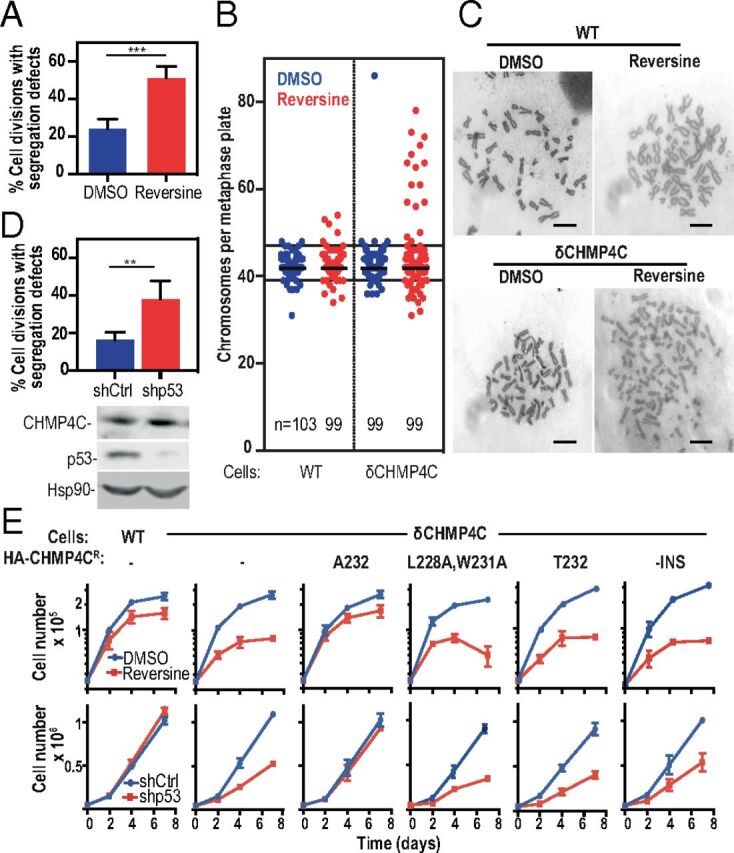
Defects in chromosome segregation and the abscission checkpoint synergize to impair cell growth. (A) HCT116 cells expressing histone H2B-mCherry were grown in the continuous presence of DMSO (blue bar) or 0.1 μM reversine (red bar), and anaphase segregation defects were scored. Data shown are the mean ± SD from n > 130 cells from three separate experiments. See also SI Appendix, Fig. S7 A and B and Movies S16–S19. (B and C) HCT116WT or HCT116δCHMP4C cells were cultured for 48 h in the continuous presence of DMSO (blue) or 0.1 μM reversine (red). Metaphases were enriched by overnight treatment with nocodazole, and chromosome number was determined. Plots show all data with medians marked. Extreme aneuploidy is defined as chromosome numbers above 48 or below 37 (solid lines). Representative metaphase spreads can be seen in C. (Scale bars, 10 μm.) Data were collected from more than four independent experiments. (D, Upper) HCT116 cells expressing histone H2B-mCherry were depleted of p53 by shRNA treatment (shp53), and anaphase segregation defects were scored. Data are expressed as the mean ± SD, n > 200, from four separate experiments across two shRNA transductions. See also SI Appendix, Fig. S7C and Movies S20–S23. (Lower) Representative immunoblots from D, Upper. (E) HCT116WT or HCT116δCHMP4C cells expressing the indicated CHMP4C construct were grown in the continuous presence of either DMSO (blue traces) or 0.1 μM reversine (red traces) (Upper Row) or were depleted of p53 by shRNA treatment (shCtrl, blue; shp53, red) (Lower Row), and cell numbers were determined at the indicated time points. Data are the mean ± SD from more than three independent experiments. P values were calculated using two-tailed unpaired Student’s t test; **P < 0.005, ***P < 0.001. See also SI Appendix, Fig. S9A.
