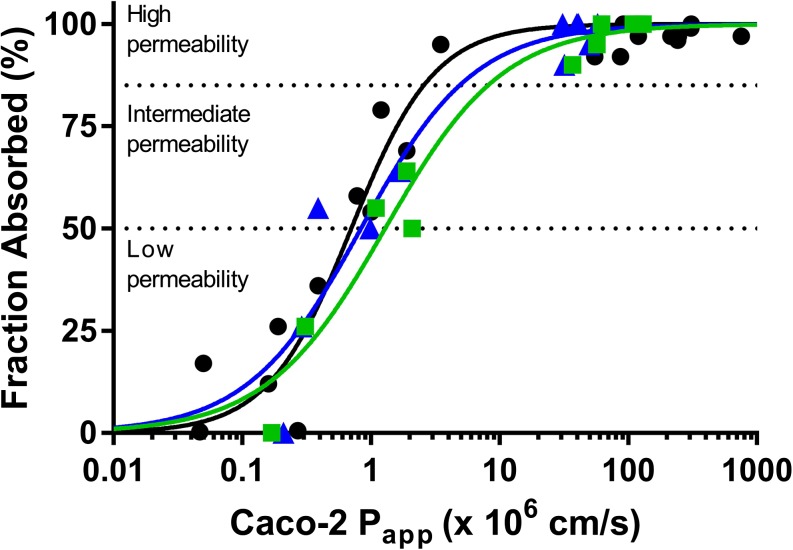
Fig. 3.
Relationship between Caco-2 cell permeability values using pH 7.4 buffer (blue) or human plasma (green) assay media and human fraction absorbed values from the literature (Table I). Blue symbols are Papp data using pH 7.4 buffer, green symbols are data obtained using human plasma and black symbols are data from Stenberg et al. using pH 7.4 buffer (36). High, intermediate and low permeability classifications are based on (7). Regression parameters are shown in Table VI. Caco-2 Papp values represent the mean of 3 measurements however error bars have been omitted for clarity.

