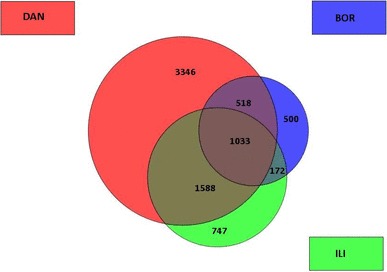
Fig. 2.

Overview of down-regulated transcripts in DAN (red), BOR (blue) and ILI (green) groups. The numbers in the circles correspond to the number of particular transcripts. Figure was created using the GeneSpring GX10 expression analysis software Agilent Technologies. (Color figure online)
