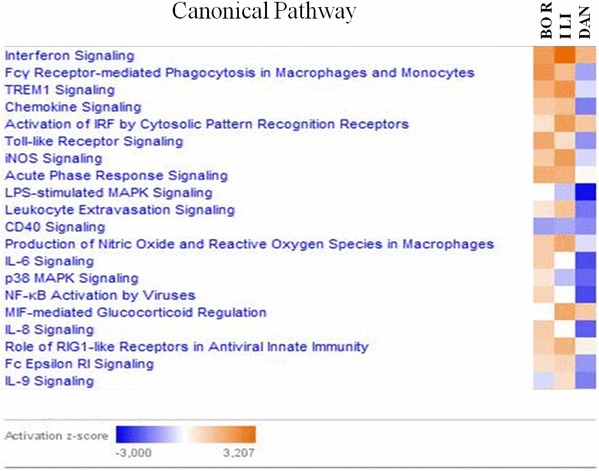
Fig. 3.

IPA comparison analysis of canonical signaling pathways activation state induced by BOR, ILI and DAN infection. Pathways shaded orange were up-regulated, in blue were down-regulated, in white are those which did not yield any changes in activity. Range of activation z-score is also depicted in the figure. (Color figure online)
