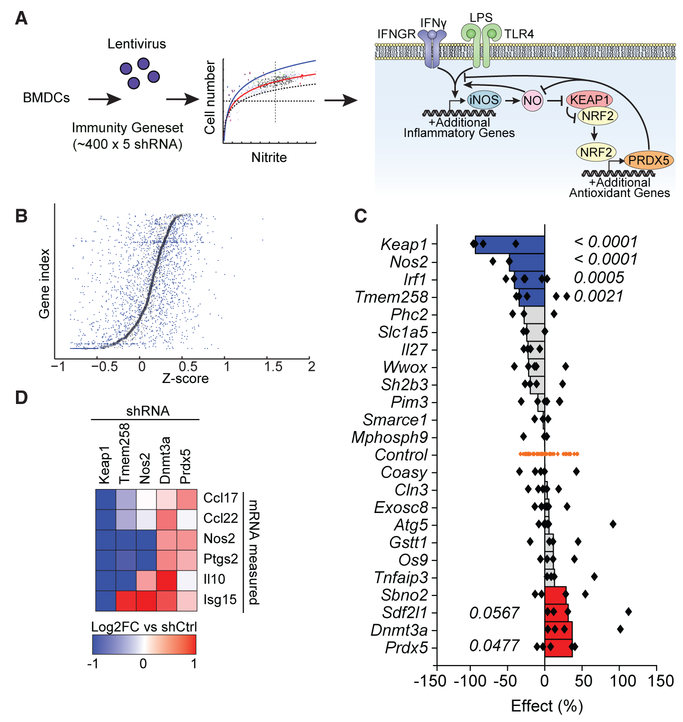
Figure 1. Functional Genetics Identifies Signaling Nodes Controlling Antimicrobial Defense.
(A) Schematic overview of shRNA screen to identify novel regulatory nodes controlling NO production in BMDCs. After stimulation with LPS and IFN-γ, NO production was measured using the Griess assay. Results implicate a model in which NO acts on Keap1 to engage an anti-inflammatory negative feedback loop. Dashed horizontal line, viability cutoff; dashed vertical line, mean NO signal. Curved lines represent best fit ± 1 SD.
(B) Individual shRNAs were scored such that their nitrite signal was normalized to cell number for each well, and genes were subsequently ranked based on plate-wide Z scores for each corresponding shRNA. Small blue dots represent Z scores for individual hairpins. Larger black boxes represent mean Z scores for all hairpins targeting the given gene.
(C) Twenty-four hits from the primary screen were retested as described in (A) and (B). Individual shRNA-level scores were calculated as percent effect relative to controls (shRNAs targeting genes not present in the mouse genome). Each dot represents an individual shRNA. Bars represent the second best shRNA for each target gene. p values were calculated by Student’s t test comparing all shRNAs for a given gene relative to control shRNAs.
(D) Top scoring hits from the validation screen were selected for further testing in assays for inflammatory transcriptional responses. Candidate genes were knocked down in BMDCs, cells were stimulated with LPS and IFN-γ, and cytokine transcripts were measured relative to control shRNAs by Fluidigm.
See also Table S1.

