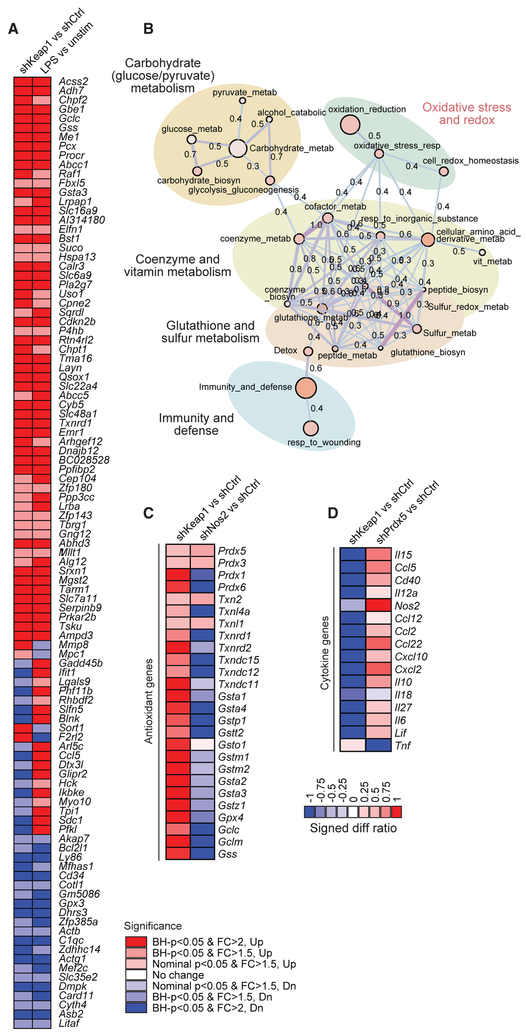
Figure 2. Reciprocal Regulation of Redox Pathways and Inflammatory Pathways.
(A) To implicate a subset of LPS-induced genes controlled by the Keap1-Nrf2 axis, target genes were knocked down in BMDCs using lentiviral delivery of shRNAs, cells were stimulated with LPS and IFN-γ for 6 hr, and transcriptional profiling was performed using RNA sequencing. We queried overlap between LPS-induced genes (LPS versus unstim) and genes upregulated by Keap1 knockdown (shKeap1 versus shCtrl). Significance is indicated by Benjamini-Hochberg (BH) p value and Log2 fold change (FC). For each target gene, 2 distinct shRNAs were used, and each was performed in technical duplicate.
(B) Functional enrichment map of the LPS-induced Keap1-Nrf2 signature highlights pathways related to redox regulation and cellular metabolism. Enrichment results represented as a network graph, with nodes denoting gene sets and color intensity corresponding to gene set enrichment score (—log10[p value]). Edges denote the extent of mutually overlapping genes between gene sets using thickness, color intensity, and the displayed Jaccard coefficient (Anderson et al., 2011; Orvedahl et al., 2011).
(C and D) Target genes were knocked down in BMDCs using lentiviral delivery of shRNAs, cells were stimulated with LPS and IFN-γ for 6 hr, and transcriptional profiling was performed using RNA sequencing to analyze antioxidant (C) and cytokine (D) gene expression. Log2 expression values are expressed as signed difference ratios relative to shRNA and scaled by normalizing to maximum absolute deviation of each gene from the shRNA control (Ng and Xavier, 2011).
See also Table S2.

